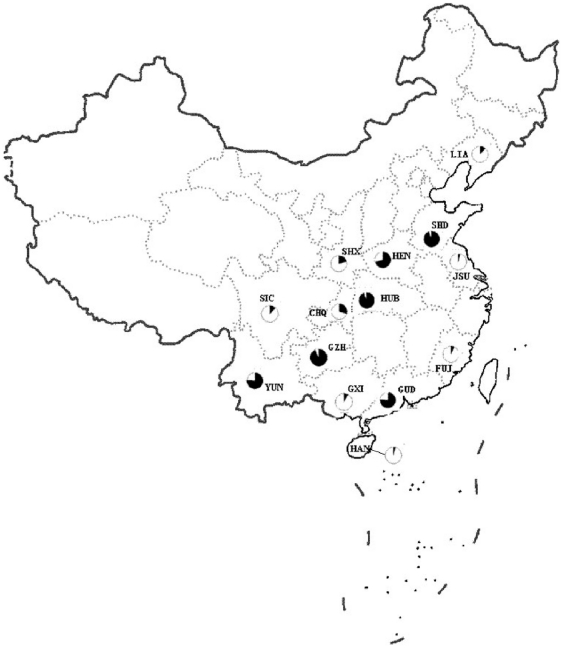
Figure 1. A schematic map of China showing sampling sites for A. sinensis.
The population genetic affiliation to the two clusters in each locality was displayed by a pie chart with black as cluster I and white as cluster II (see Table 3 for details).

