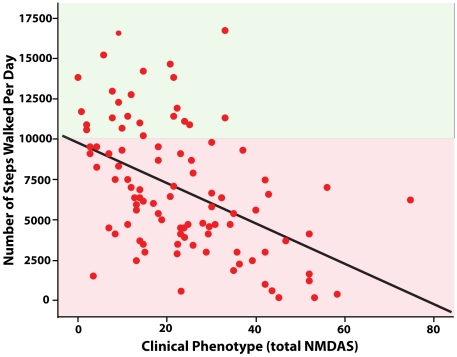
Figure 1. Scatter plot of the relationship between disease burden (total NMDAS score) and habitual physical activity (steps walked per day) (unadjusted regression line, R-Sq = 0.22, p<0.001).
The red zone represents under and green zone over 10,000steps per day; the advised level of physical activity by the World Health Organisation [22] for health.

