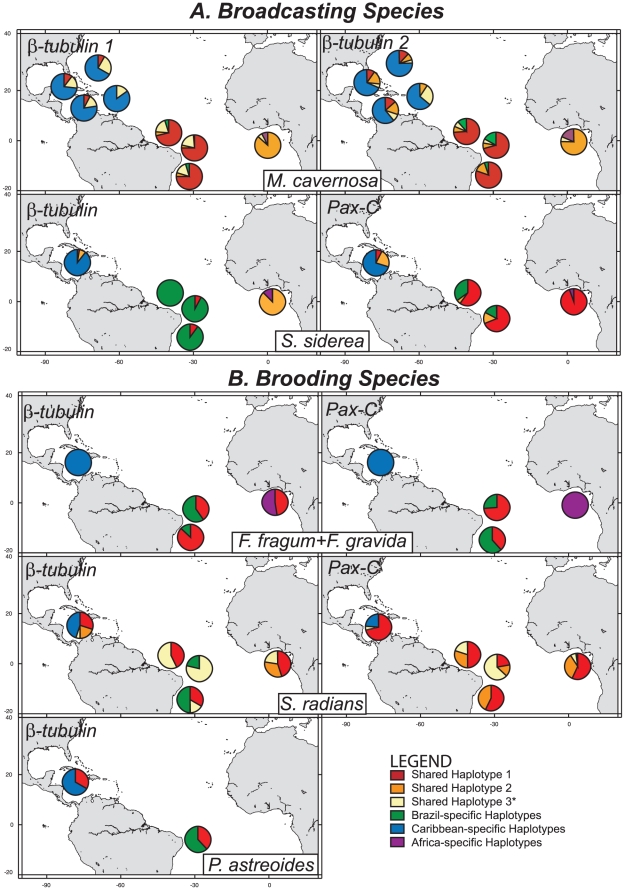
Figure 2. Haplotype frequency pie charts for coral populations across the Atlantic for (A) broadcasters and (B) brooders.
The three most commonly occurring haplotypes shared between regions for each species and locus have been coded with the same color (see legend). Private alleles for each geographic region have been binned into one category for clarity. *For M. cavernosa, “Shared Haplotype 3” is a sum of the frequencies of all haplotypes shared in two of the three regions.

