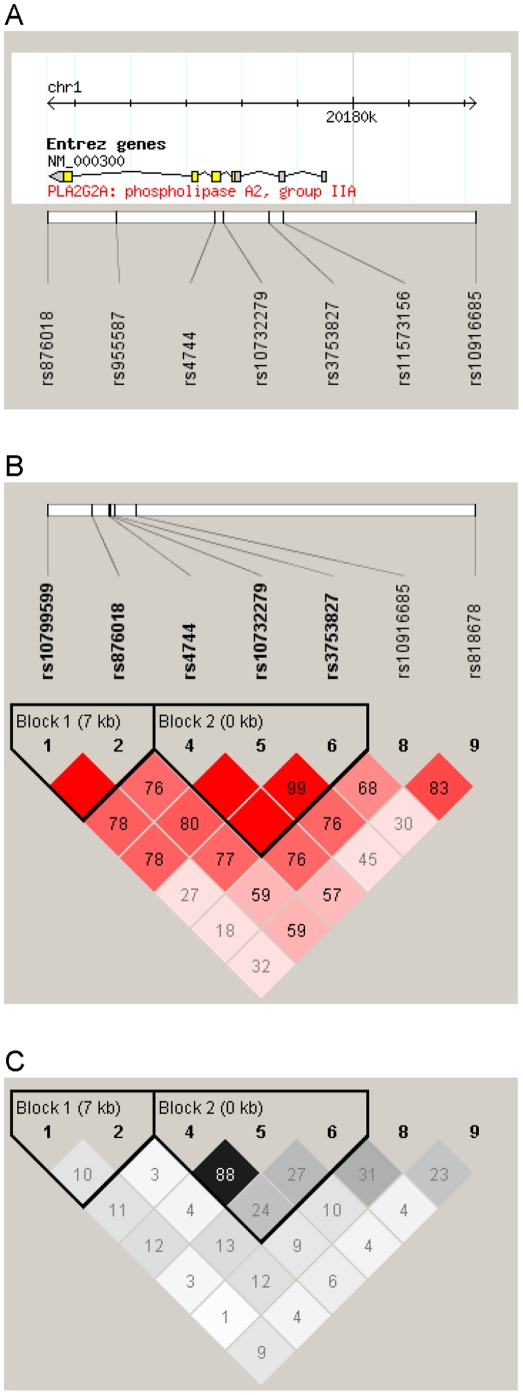
Figure 1. Location of the single nucleotide polymorphisms genotyped in this study in relation to the PLA2G2A gene (Panel A) and linkage disequilibrium patterns between the markers considered for haplotype estimation (Panels B and C).
Panel A: depicted is chromosome 1, 20174.5–20182.2 kb; not shown are rs10799599 at position 20167087 and rs818678 at position 20238917. Panels B and C: D' values in Haploview standard colouring scheme are shown in B, r2 values in Haploview r2 colouring scheme are shown in C. Haplotype blocks were identified by Haploview's confidence interval option.

