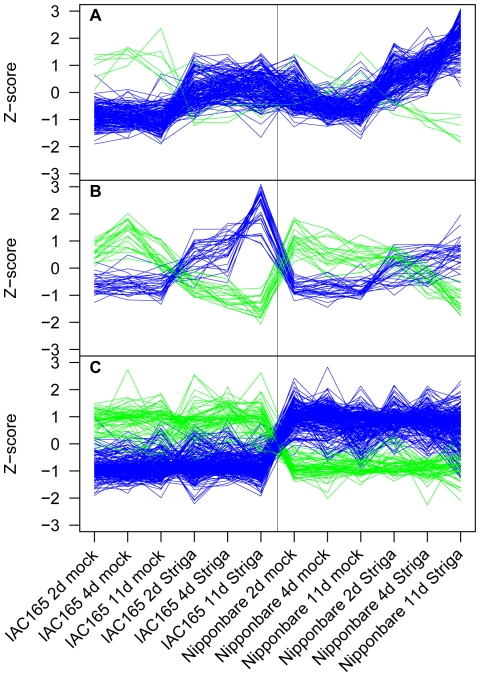
Figure 2. Normalized expression values of modules of genes identified from a Striga root infection study.
Gene expression values from Striga hermonthica root infection time course of rice cultivars IAC165 and Nipponbare were processed using Weighted Gene Coexpression Network Analysis to identify modules of highly correlated genes [36], [43]. Expression data are represented here as normalized values (Z-scores). Two gene modules, (A) GSE10373-blue and (B) GSE10373-brown, display differential responses between genes in the two cultivars in response to infection by S. hermonthica. Genes from one module, (C) GSE10373-turquoise, are differentially expressed between the two rice cultivars but are not responsive to infection by S. hermonthica. Plots for genes that are positively correlated with each other within a module are shown in the same color. Genes within a module that are displayed in different colors are anti-correlated.

