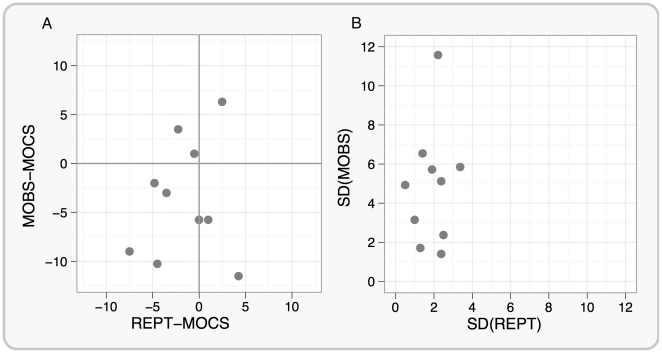
Figure 2. Comparisons of REPT and MOBS performance in terms of accuracy (Panel A) and variability (Panel B) for 10 participants.
Panel A shows the difference between REPT and MOCS on the horizontal axis and the difference between MOBS and MOCS on the vertical axis, for each participant. It is clear that the REPT-MOCS values are closer to zero than are the MOBS-MOCS values, as confirmed by the fact that the absolute difference between REPT and MOCS was significantly smaller than the absolute difference between MOBS and MOCS. This suggests that REPT thresholds were more accurate than MOBS thresholds. Panel B displays the relationship between the standard deviation of REPT and MOBS thresholds for each participant. The variability of phosphene thresholds measured with REPT was significantly lower than the variability of phosphene thresholds measured with MOBS which suggess that REPT thresholds were more consistent.

