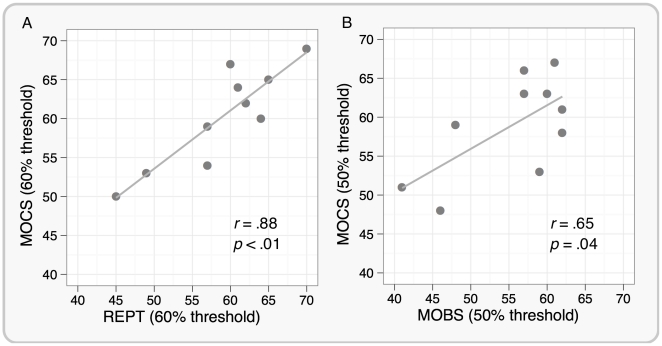
Figure 3. Scatterplot between REPT and MOCS (Panel A), and MOBS and MOCS (Panel B) phosphene thresholds for 10 participants.
Both REPT and MOBS thresholds well correlated with the phosphene thresholds estimated using MOCS. However, the relationship between REPT and MOCS appears stronger than between MOBS and MOCS.

