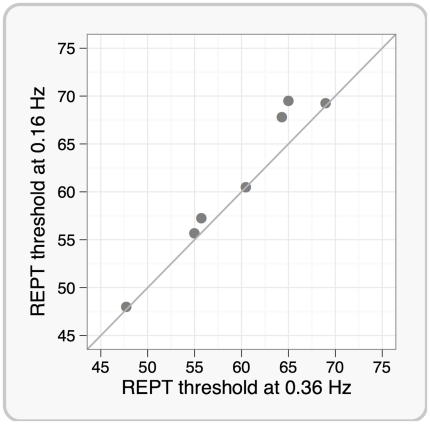
Figure 5. The effect of stimulation frequency on phosphene thresholds using REPT for 7 participants.
This scatterplot shows mean phosphene thresholds for each participant estimated using REPT with the average stimulation frequency of 0.36 Hz on the horizontal axis and 0.16 Hz on the vertical axis. The diagonal line indicates where the two estimates are equivalent. No statistically significant difference between the slow and fast staircases was found.

