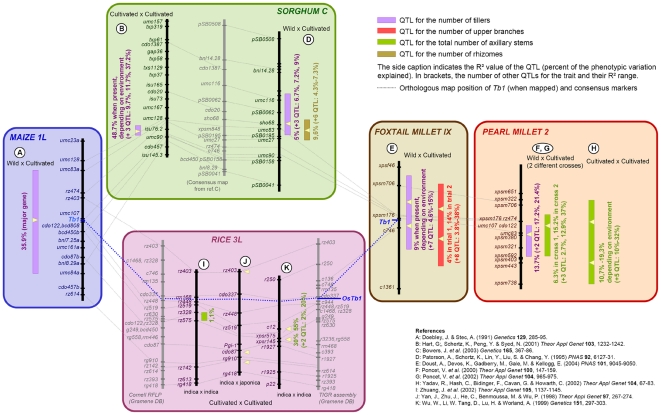
Figure 2. Comparative mapping of domestication QTLs for vegetative branching in cereals.
The orthologous map segments syntenic to the maize Tb1 region are aligned following consensus markers (linked by dotted grey lines). QTLs associated to branching are indicated by their confidence intervals (colored boxes). The respective percent phenotypic variance they explain (R2) is reported alongside the number and effects of other QTLs in the same cross. These QTLs tend to be consistently conserved at similar positions around the mapped or predicted location of Tb1 orthologues in sorghum, foxtail millet and pearl millet, and in some rice crosses involving parents with contrasted vegetative branching architecture.

