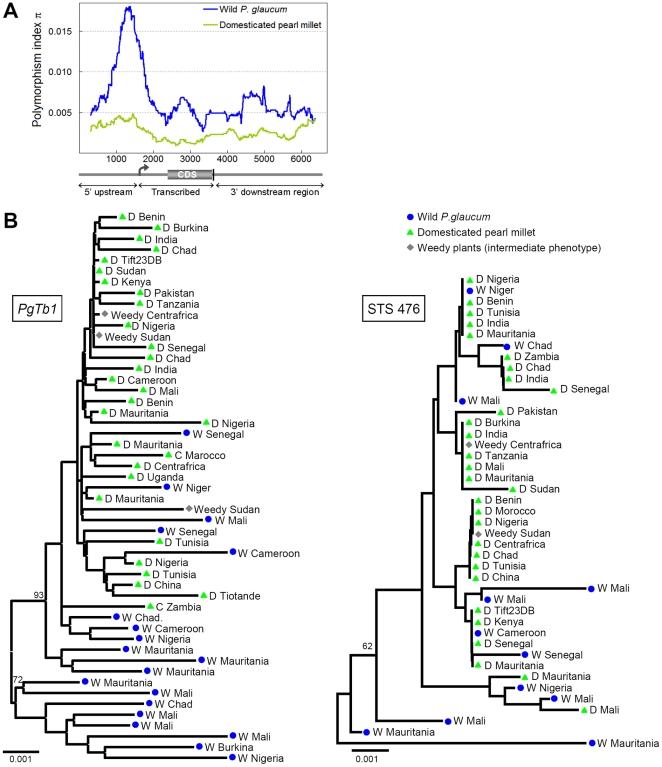
Figure 5. Molecular polymorphism at the PgTb1 locus.
A. Sliding-window plot of the polymorphism index π in the PgTb1 region. Values were calculated separately in wild (blue) and domesticated (green) samples in a 600 bp window. B. Genetic tree of PgTb1 alleles (right) and for one of the STS loci (left), constructed using the neighbor-joining method and the Kimura-2P distance (gaps excluded). Significant bootstrap support is indicated at the node and was calculated for 1,000 random permutations.

