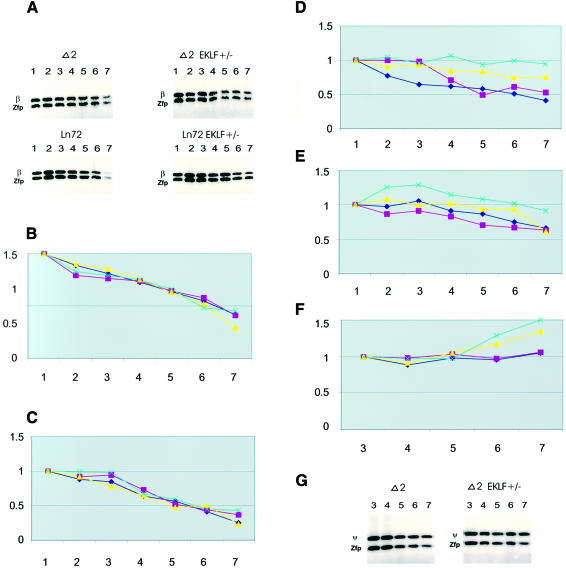
Fig. 5. DNase I accessibility verified by DNase I-PCR method. Y-axis: an increase in the relative amount of PCR product (normalized to Zfp37 for each DNase I concentration), reflects a decrease in DNase I sensitivity; X-axis: increasing DNase I concentration (see Materials and methods). For all PCR product sizes see Materials and methods. (A) The limit PCR product series of the human β globin promoter relative to the Zfp37 promoter. The β globin product is 163 bp, the Zfp product is 149 bp. (B) Zfp37 promoter region (note that the Y-axis in this and following plots represents the amount of PCR product relative to the amount of Zfp37 PCR product at the lowest DNase I concentration). (C) Mouse β major promoter region relative to Zfp37, the mouse β globin PCR fragment (see Materials and methods). (D) Human β globin promoter region. (E) Human δ globin gene promoter. (F and G) The ψβ region of the human locus (only the high DNase concentrations are shown). The black lines represent the DNase I sensitivity of the different regions of the mouse or human loci in line 72 wild type; in red are the results for line 72 EKLF+/–; in yellow are the results for Δ2B wild type; in blue are the results for Δ2B EKLF+/–.

An official website of the United States government
Here's how you know
Official websites use .gov
A
.gov website belongs to an official
government organization in the United States.
Secure .gov websites use HTTPS
A lock (
) or https:// means you've safely
connected to the .gov website. Share sensitive
information only on official, secure websites.
