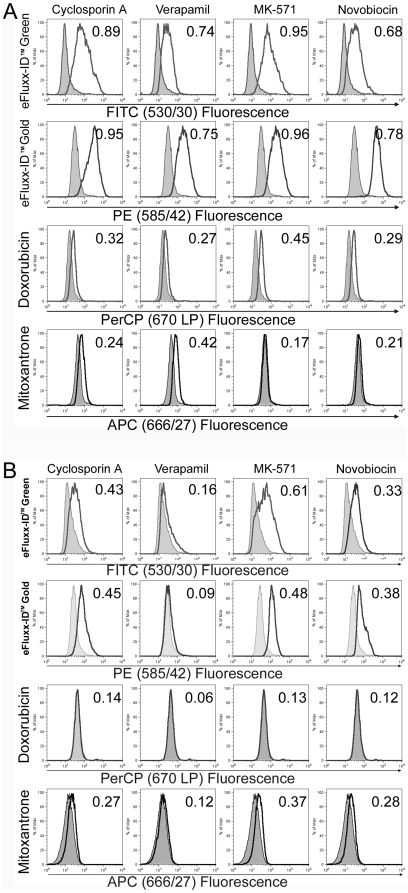
Figure 2. eFluxx-ID® MDR probes detect all three major types of ABC transporters in a similar manner as doxorubicin and mitoxantrone probes, but are significantly brighter, providing much higher sensitivity compared with the other dyes.
Model cell lines (CHO K1, panel A, and A549, panel B) were trypsinized, washed with PBS, aliquoted at 5×10⁵ cells/sample, and treated in triplicates with different inhibitors (5 µM of cyclosporin A, 20 µM of verapamil, 50 µM of MK-571, or 0.05 µM of novobiocin) or left untreated. Tested probes (eFluxx-ID® Green, eFluxx-ID® Gold dyes, doxorubicin or mitoxantrone) were added to every sample. The cells were incubated with the dye(s) in the presence or absence of inhibitors for 30 min at 37°C. Then cells were immediately analyzed by flow cytometry. Population comparison was performed using Kolmogorov-Smirnov statistics [26]. Clear histograms represent sample fluorescence in the presence of the inhibitor, shaded – without the inhibitor. The numbers indicate average D-values for each sample from at least three independent experiments, with SD not exceeding 10% for each value.

