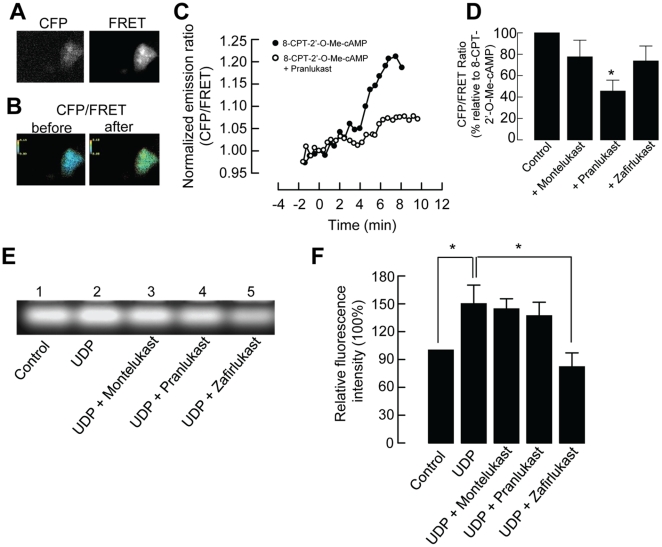
Figure 6. Effects of CysLT1 receptor antagonists on Epac activation and PKA activity.
(A) The monochrome CFP and FRET images showing the cytosolic distribution of the fluorescent Epac probe in 16HBE14o- cells transfected with CFP-Epac-YFP. (B) Representative pseudocolor images of CFP/FRET emission ratios before and after the addition of 8-CPT-2′-O-Me-cAMP. (D) Real-time cAMP changes (normalized CFP/FRET emission ratio) recorded in cells stimulated with 50 µM 8-CPT-2′-O-Me-cAMP with or without 1 µM pranlukast shown in (B). The agents were added at time zero. (C) Summarized data showing the effect of CysLT1 receptor antagonists on the CFP/FRET emission ratio. Each column represents the mean ± S.E. (n = 8–10). (*, p<0.05, Student's t-test compared with control). (E) Confluent 16HBE14o- cells were treated with either vehicle alone (control), 100 µM UDP, or UDP with different CysLT1 receptor antagonists (1 µM) for 5 min. PKA activity was measured as a function of fluorescence intensity. (F) Summarized data showing the relative fluorescence level as compared with the control level. Each column represents the mean ± S.E. (*, p<0.05, n = 4, one-way ANOVA with Bonferroni post-hoc test).

