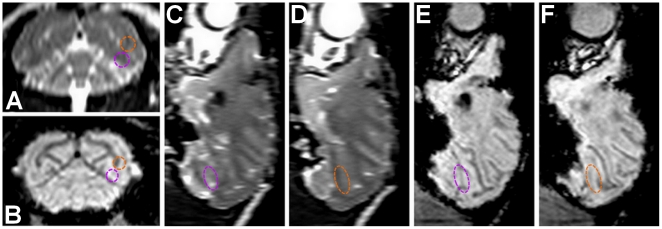
Figure 2. Damage assessment.
(A,C,D) 3D T2-weighted sequence. Edemas should appear brighter in these images. (B,E,F) 3D Susceptibility-Weighted Image (SWI) sequence was applied. Hemorrhages, as well as large vessels should appear in black in these images. (A,B) Same reconstructed coronal slice as shown in figure 1. The two opening sites are circled with the corresponding colors. There is no difference between the two hemispheres. (C,D,E,F) Corresponding reconstructed sagittal slices for the two opening sites. No oedemas or hemorrhages are visible.

