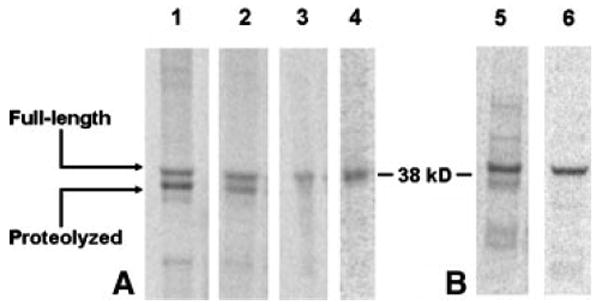
Figure 2. Autoradiography analysis of fusion reprogramming factor proteolysis.

4-μL samples of soluble CFPS product were separated by SDS-PAGE. (A) Analysis of R9-Nanog proteolysis. 1: KC6 extract, expressed at 37 °C. 2: KC6 extract, 25 °C. 3: KC6 + Roche protease inhibitor, 25 °C. 4: BL21(DE3)Star protease-deleted extract, 25 °C. (B) Insight gained from solving R9-Nanog proteolysis is transferable to R9-Sox2. 5: KC6 extract, 37 °C. 6: BL21(DE3)Star protease-deleted extract, 25 °C. Representative images of individual lanes were selected from n=3 experiments.
