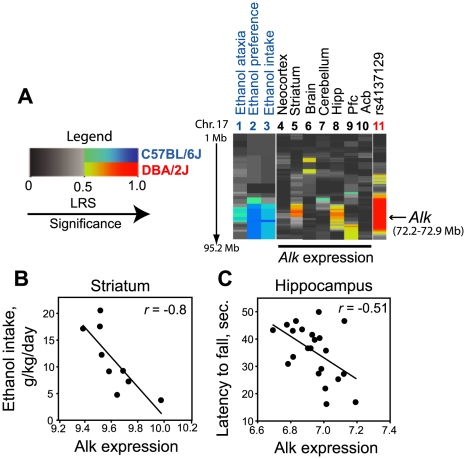
Figure 3. Putative regulation of ethanol-related behaviors and brain Alk expression by the Alk locus.
(A) Heat map of mouse chromosome 17 (right panel) depicting correlations between ethanol-related traits (lanes 1–3), Alk expression in specific brain regions (lanes 4–10) and genotype at the Alk locus (lane 11). Legend for the heat map is shown on the left. Blue indicates that the C57BL/6J genotype at the locus is associated with increased expression of the trait, red indicates the same for DBA/2J genotype, and increased likelihood ratio statistic (LRS) is indicated by darker color. The red region surrounding the marker rs4137129 in the Alk locus (lane 11) is arbitrarily colored and indicates the extent of linkage disequilibrium. (B) Scatter plot depicting the correlation between Alk expression in the striatum and ethanol intake. Lower Alk expression was associated with increased ethanol intake. (C) Scatter plot depicting the correlation between hippocampal Alk expression and the latency to fall in seconds as a measure of ethanol-induced ataxia using the screen test. Lower Alk expression was correlated with increased latency to fall.

