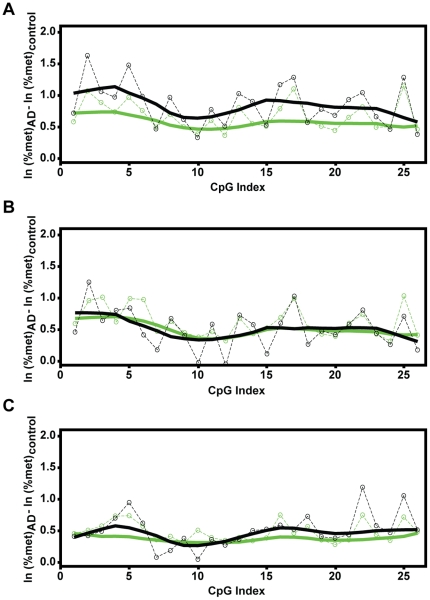
Figure 4. Local regression analysis of mC content across the rDNA promoter.
After logarithmic transformation of the data from Fig. 3, the mean differences in methylation of each of 26 individual CpG sites in the rDNA promoter were determined as indicated. A, Local regression analysis of the mean difference between MCI- and control groups (parietal cortex) indicates significant hypermethylation of all CpGs of the rDNA promoter. The circles indicate the actual mean difference values; the black solid line represents a smoothed regression fit of those values across the rDNA promoter region; the green lines indicate the border of the 95% confidence range for the actual values (dashed line) or the smoothed regression (solid line). Note that the black smoothed regression line does not leave the 95% confidence range, indicating a significant hypermethylation trend for all the CpG sites. B–C, Similar analysis of the data for the AD samples from the parietal (B) and the prefrontal cortex (C) identifies AD-associated hypermethylation of large portions of the rDNA promoter.

