
Figure 3. Zap1 DNA binding is controlled in vivo without autoregulation.
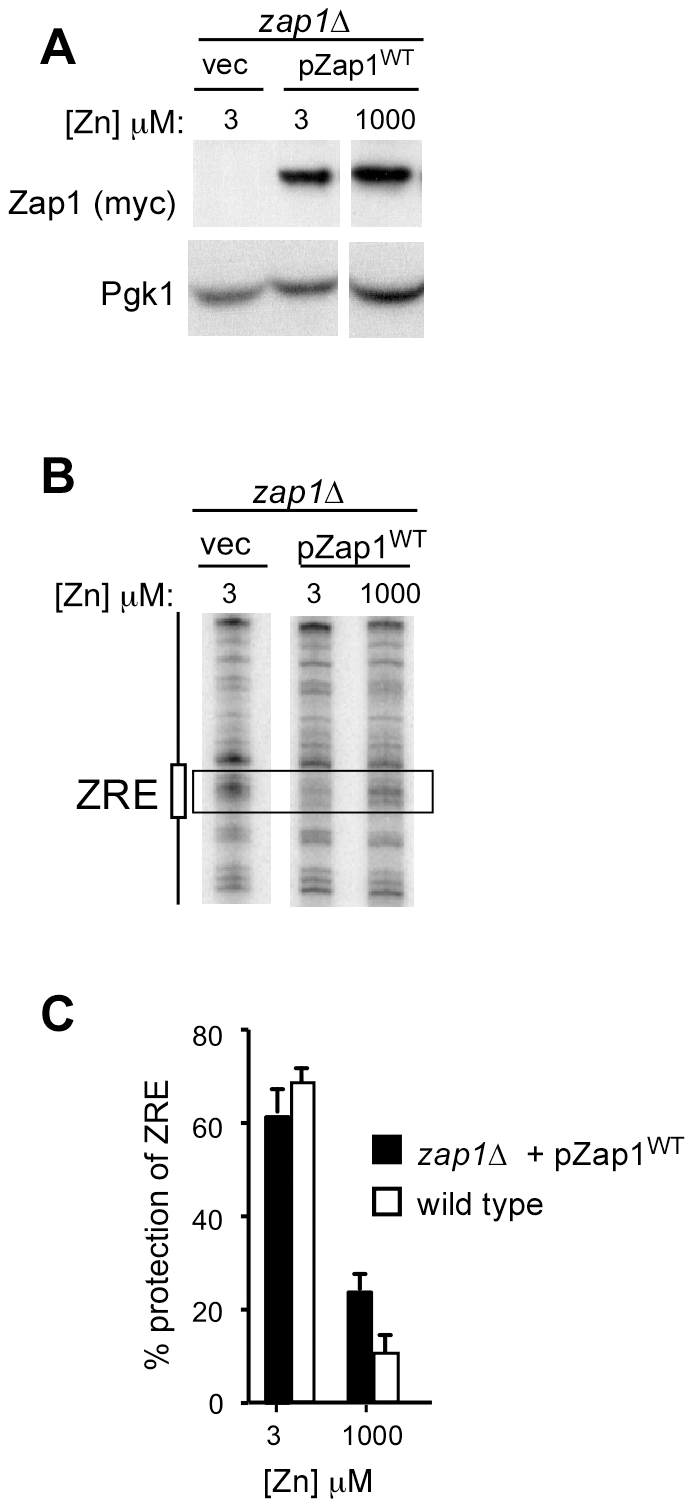
A) ZHY6 zap1Δ mutant cells transformed with either pZap1WT or the vector pYef2 were grown to exponential phase in LZM+3 µM and LZM+1000 µM ZnCl2. LZM contains 2% glucose as carbon source so expression of Zap1 from the GAL1 promoter is at low levels similar to endogenous Zap1. Total protein extracts were prepared and subjected to immunoblot analysis using antibodies against Zap1 (myc) and Pgk1. B) ZHY6 zap1Δ cells transformed with the vector (pYef2) or pZap1WT were grown to exponential phase in LZM+3 or 1000 µM zinc. Cells were than analyzed by in vivo DMS footprinting. The box indicates the position of the ZRE and the bands used for quantification of protection. C) The experiment shown in Figure 3B was repeated a total of six times and quantified as described in the Materials and Methods. The mean percent protection levels are shown and the error bars indicate 1 S.D. Data for wild-type cells from Figure 2B are shown again here for comparison.