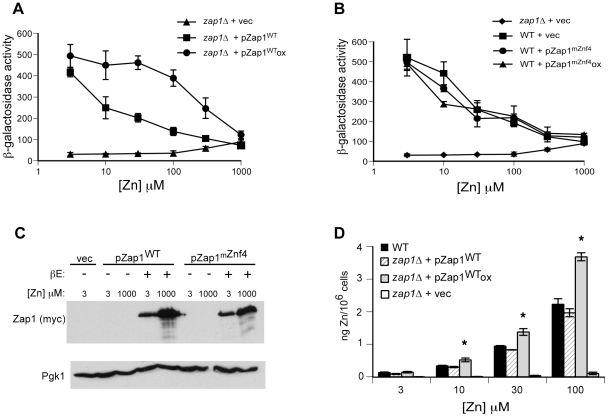
Figure 8. Overexpressing Zap1 disrupts gene regulation and zinc homeostasis.
A) ZHY6 zap1Δ cells transformed with pGEV, the pGI-1 ZRT1-lacZ reporter and either pZap1WT or pYef2 vector were grown to exponential phase in LZM supplemented with the indicated concentration of ZnCl2. To induce high Zap1 expression, cells were treated with 1 µM β-estradiol (ox). Cells were then harvested and β-galactosidase assays were performed. B) Wild-type DY1457 cells transformed with pGEV, the pGI-1 ZRT1-lacZ reporter, and either pYef2 or pZap1mZnf4 were grown to exponential phase in LZM supplemented with the indicated concentration of ZnCl2. To induce high Zap1mZnf4 levels, cells were treated with 1 µM β-estradiol (ox). Cells were then harvested and β-galactosidase assays were performed. The values shown in panels A and B are the means of three independent cultures, and the error bars equal ±1 S.D. C) Protein extracts were generated from the samples described in panels A and B and subjected to immunoblot analysis using antibodies against Zap1 (myc) and Pgk1. D) Wild-type DY1457 cells and ZHY6 zap1Δ cells transformed with pGEV and either the pYef2 vector or pZap1WT were inoculated at an A600 of 0.02 in LZM supplemented with the indicated concentration of ZnCl2 plus tracer amounts of 65ZnCl2. To induce high levels of Zap1WT protein expression, cultures were treated with 1 µM β-estradiol (Zap1WTox). Cultures were grown to an A600 of ∼0.75, after which zinc accumulation was measured. Shown are the means of three independent cultures and the error bars indicate ±1 S.D. The asterisks indicate a significant difference (p<0.05) of zap1Δ cells expressing Zap1WTox relative to Zap1WT controls as determined by 2-sided Student t-test.

