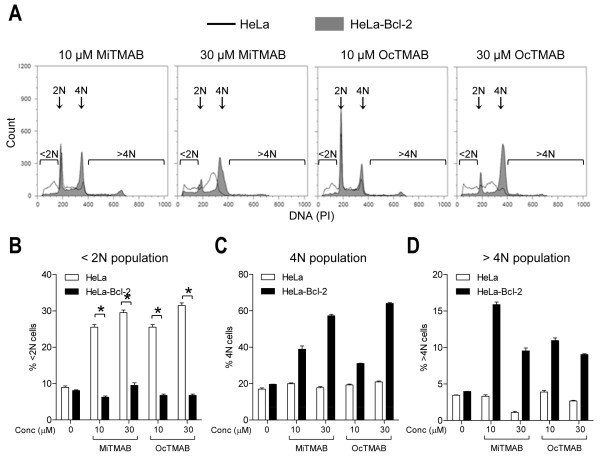
Figure 4.
Over-expression of Bcl-2 protects cells from MiTMABs-induced cell death. A-D, G2/M synchronized HeLa (empty histograms) and HeLa-Bcl-2 (filled histograms) cells were synchronized at the G2/M boundary. Once released from this block, cells treated with MiTMAB, OcTMAB or indicated controls, were incubated for 20 h and their DNA contents analysed by flow cytometry. Representative flow cytometry histograms show a decrease in the <2N peak and an increase in the 4N peak in HeLa-Bcl-2 cells treated with MiTMAB (filled histograms) compared to parental HeLa cells (empty histograms; A). Graphs showing the percentage of HeLa and HeLa-Bcl-2 cells (mean ± S.D.) containing <2N (B), 4N (C) and >4N (D) DNA contents are shown. * p < 0.05, ** p < 0.01 (Student's t tests).

