
Figure 2.
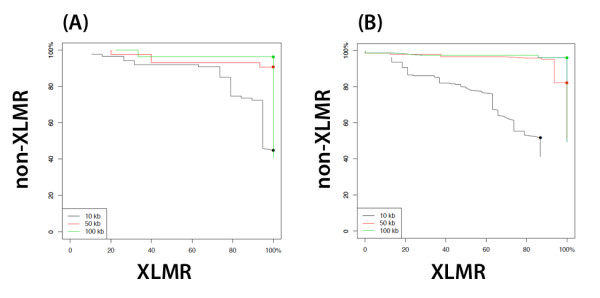
LDA classification success rates for different values of the tuning parameter. (A) All XAR genes were used for training and test sets. (B) All XCR genes were used for training and test sets. Leave-one-out cross-validation was utilized to calculate correct classification rates. Dots indicate optimal values of τ. More detailed information is given in Table 3.