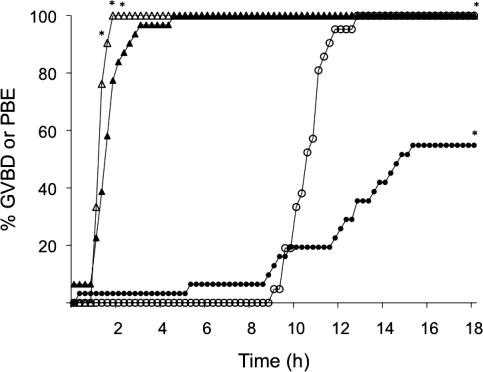
FIG. 3.
Kinetics of maturation of oocytes derived from the ovaries of CF1 mice after follicle culture in vitro and from oocytes that develop in vivo. Triangles represent percentage of oocytes completing GVBD; circles represent percentage of oocytes expelling a PB (PBE). Solid symbols represent oocytes from the alginate culture system; open symbols represent oocytes from control mice. The experiment was performed two times, and at least 50 oocytes were examined for each time point. *P < 0.05.

