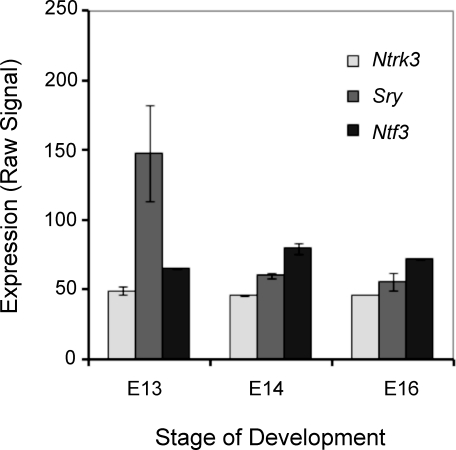
FIG. 2.
Ntf3 and Sry expression profiles during embryonic testis development in the rat from a microarray analysis data set [27]. Relative expression versus embryonic day of development is presented. Original data were reanalyzed with Partek software (Affymetrix, Palo Alto, CA) and RMA (R) analysis with the mean ± SEM presented. All data points have error bars; if an error bar is not apparent, then it is small and covered by the data point symbol.

