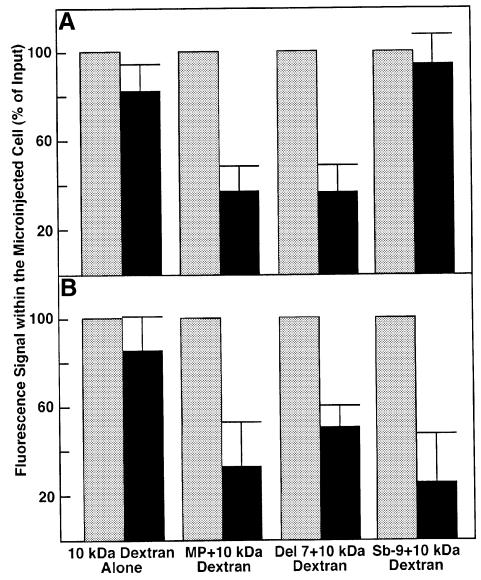
Fig. 4. Quantification of MP-induced intercellular movement of fluorescent dextrans. Fluorescently labeled dextran (10 kDa) was microinjected either alone or as a mixture with the indicated MP derivatives into N.tabacum (A) or N.benthamiana (B). Fluorescent signal within the injected cell was quantified 5 min (shaded bars) and 30 min (black bars) after injection as described in Materials and methods. The measurements and the indicated standard deviations represent the results of a series of independent microinjections summarized in Table I.

An official website of the United States government
Here's how you know
Official websites use .gov
A
.gov website belongs to an official
government organization in the United States.
Secure .gov websites use HTTPS
A lock (
) or https:// means you've safely
connected to the .gov website. Share sensitive
information only on official, secure websites.
