

Abstract
Damage to DNA by dopamine quinone and/or catechol estrogen quinones may play a significant role in the initiation of Parkinson’s disease (PD). Depurinating estrogen-DNA adducts are shed from cells and excreted in urine. The aim of this study was to discover whether higher levels of estrogen-DNA adducts are associated with PD. Forty estrogen metabolites, conjugates and DNA adducts were analyzed in urine samples from 20 PD cases and 40 matched controls by using ultraperformance liquid chromatography/tandem mass spectrometry. The levels of adducts in cases vs controls (p<0.005) suggest that unbalanced estrogen metabolism could play a causal role in the initiation of PD.
Keywords: catechol estrogen quinones, depurinating estrogen-DNA adducts, urinary biomarkers, UPLC-MS/MS
INTRODUCTION
Parkinson’s disease (PD) is the second most common neurodegenerative disorder, after Alzheimer’s disease, affecting more than 1 million Americans over the age of 55. The hallmark of PD is the specific and progressive degeneration of nigrostriatal dopamine neurons and depletion of dopamine (DA) (Shastry 2000, Dauer & Przedborski 2003, Huang et al 2003). PD symptoms are apparent only after loss of dopaminergic neurons in the substantia nigra is at least 50%, leading to more than 80% reduction in dopamine levels in the striatum (Lang & Lozano 1998, Deumens et al 2002). Several causal mechanisms have been postulated regarding the neuronal degeneration that occurs in PD (Figure 1) (Lang & Lozano 1998, Shastry 2000, Deumens et al 2002, Dauer & Przedborski 2003, Huang et al 2003). These include genetic factors, mitochondrial dysfunction, environmental toxins, and oxidative stress (Steece-Collier et al 2002, Henchcliffe & Beal 2008, Hatcher et al 2008, Chinta & Andersen 2008). Four genes have been found to be associated with inherited parkinsonism: α-synuclein, parkin, ubiquitin C-terminal hydrolase L1 (UCH-L1) and LRRK2 (Kitada et al 1998, Leroy et al 1998, Maries et al 2003, Paisan-Ruiz et al 2004, Zimprich et al 2004). Mutations in α-synuclein (Cookson & van der Brug 2008), parkin and UCH-L1 genes (Gasser 2005, Gong & Leznik 2007) may ultimately lead to PD. Environmental factors such as pesticides, herbicides and industrial chemicals have been identified as potential risk factors for PD, primarily through their mediation of increased oxidative stress (Maguire-Zeiss et al 2005). Highly oxidative conditions in dopaminergic neurons are thought to be responsible for oxidative stress that has long been associated with development of PD.
Figure 1.

Proposed mechanism of initiation of neurodegeneration or cancer by dopamine and/or catechol estrogens.
It has been proposed that DA itself or its metabolite DA-quinone (DA-Q) may be responsible for the selective toxicity to dopaminergic neurons (Bisaglia et al 2007). At physiological pH, intramolecular cyclization of DA-Q by 1,4-Michael addition forms leukochrome, followed by aminochrome and ultimately neuromelanin (Figure 1). However, a low pH environment partially protonates the amino group of DA, which slows the intramolecular cyclization of DA-Q and enables a competitive intermolecular 1,4-Michael addition with DNA and other cellular macromolecules (Figure 1) (Cavalieri et al 2002, Zahid et al 2011). As discussed above, toxicant and environmental triggers combined with genetic vulnerability are likely to converge on a common pathway toward cell death in PD. Idiopathic PD is responsible for some 95% of cases, and genetic mutations account for less than 10% of the total PD cases, suggesting that sporadic PD cases arise from a combination of genetic vulnerability and environmental exposure (Mizuno et al 2001, Tanner 2003). Although a number of different mechanisms have been proposed in the etiology of PD, none have been considered to have absolute predominance.
Catechol estrogens are present in the brain (Parvizi & Ellendorff 1983, Banger et al 1990, Mitamura et al 2000). Like DA, catechol estrogens can be bioactivated to catechol quinones (Figure 1). The catechol quinones of both DA and estradiol (E2) react with cellular macromolecules. The catechol quinone of DA reacts with DNA to form DNA adducts (Figure 1) (Levay et al 1997, Cavalieri et al 2002, Zahid et al 2011), analogously to the adducts that are formed by the catechol quinone of E2 (Figure 1) (Cavalieri et al 2006). In addition, deactivating enzymes such as NQO1 and NQO2 are shown to detoxify DA-Q as well as E2-3,4-Q (Harada et al 2001, Zafar et al 2006, Gaikwad et al 2007, Gaikwad et al 2009c). Since DA and estrogen quinones follow similar metabolic activation and deactivation pathways and both interact with macromolecules, catechol estrogen quinones present in the brain could complement the toxicity of DA-Q.
Our laboratory has extensively investigated the molecular mechanisms of estrogen carcinogenesis operating through catechol estrogens, and we have provided ample evidence that the formation of depurinating estrogen-DNA adducts is a critical step in cancer initiation (Cavalieri & Rogan 2010). Estrogen metabolism is a balanced set of activating and deactivating pathways (Figure 2). When it is in balance, oxidation of the catechol estrogens to quinones is minimized, but when the metabolism is unbalanced, formation of the reactive catechol estrogen quinones increases, resulting in additional DNA adducts (Figure 2). The predominant depurinating estrogen-DNA adducts 4-OHE1(E2)-1-N3Ade and 4-OHE1(E2)-1-N7Gua (Cavalieri et al 2006) are shed from cells into the bloodstream and, eventually, are excreted in urine (Gaikwad et al 2008, Gaikwad et al 2009a,b, Yang et al 2009). The release of the depurinating adducts generates apurinic sites in the DNA which, in turn, induce mutations (Cavalieri et al 2006). Considering the resemblance of bioactivation of endogenous catechol estrogens and DA and their involvement in binding to DNA (Figure 1), we were interested in testing the hypothesis that the depurinating estrogen-DNA adducts may be involved in the etiology of PD, and the results presented in this article are consistent with this hypothesis.
Figure 2.

Biosynthesis and metabolic activation of estrogens. Metabolic activation of 2- and 4-catechol estrogens yields the corresponding reactive quinones. The quinones react with DNA to form depurinating DNA adducts. In deactivation, the catechol estrogens are methylated to form methoxy catechol estrogens; in addition, the quinones are reduced by quinone reductase, as well as conjugated with GSH, and are thus rendered harmless. A shift in the apparent balance between these activating and deactivating pathways towards formation of depurinating DNA adducts could lead to the initiation of PD.
MATERIALS AND METHODS
Phenyl solid phase extraction (SPE) cartridges were purchased from Varian (Palo Alto, CA). Androstenedione (AD), testosterone (T), estrone (E1) sulfate, E2, 2-OHE2, 2-OHE1, 16α-OHE2, 16α-OHE1, 2-OCH3E2, 2-OCH3E1, 4-OCH3E2, 4-OCH3E1, 2-OH-3-OCH3E2 and 2-OH-3-OCH3E1 were purchased from Steraloids Inc. (Newport, RI). 4-OHE2 and 4-OHE1 were synthesized as previously described (Saeed et al 2005). 2-OHE2-1-SG, 2-OHE2-4-SG, 2-OHE1-1-SG, 2-OHE1-4-SG, 2-OHE2-(1+4)-Cys, 2-OHE1-1-Cys, 2-OHE1-4-Cys, 2-OHE2-1-NAcCys, 2-OHE2-4-NAcCys, 2-OHE1-1-NAcCys, 2-OHE1-4-NAcCys, 4-OHE2-2-SG, 4-OHE1-2-SG, 4-OHE2-2-Cys, 4-OHE1-2-Cys, 4-OHE2-2-NAcCys and 4-OHE1-2-NAcCys, 4-OHE2-1-N7Gua, 4-OHE1-1-N7Gua, 4-OHE2-1-N3Ade, 4-OHE1-1-N3Ade, 2-OHE2-6-N3Ade and 2-OHE1-6-N3Ade were synthesized by following reported methods (Stack et al 1996, Cao et al 1998, Li et al 2004, Zahid et al 2006). All solvents were HPLC grade and all other chemicals used were of the highest grade available.
Study population and sample collection
Sixty urine samples were collected. Fifteen men (age range 43–76, median 64) and five women (age range 54–86, median 77) with PD were recruited from the Neurology Clinic, University of Nebraska Medical Center (UNMC) between September and December, 2007 (Table 1). One of the inclusion criteria was fulfilling “Gelb” criteria for probable PD (Gelb et al 1999). Patients with known history of breast or prostate cancer were excluded. For each PD sample, two gender-matched healthy controls were recruited. The UNMC Institutional Review Board approved all procedures, and signed consents included authorization to collect and bank urine samples and collect demographic and clinical information.
Table 1.
Characteristics of Parkinson’s Disease patients
| Subject | Gender | Race | Age | Age at Onset | Family History |
|---|---|---|---|---|---|
| 1 | Female | Caucasian | 85 | 72 | No |
| 2 | Female | Caucasian | 54 | 49 | No |
| 3 | Female | Caucasian | 56 | 55 | No |
| 4 | Female | Caucasian | 77 | 71 | No |
| 5 | Female | Caucasian | 86 | 79 | No |
| 6 | Male | Caucasian | 53 | 46 | No |
| 7 | Male | Caucasian | 69 | 54 | Yes*,** |
| 8 | Male | Caucasian | 74 | 68 | No |
| 9 | Male | Caucasian | 64 | 61 | Yes* |
| 10 | Male | Caucasian | 47 | 45 | No |
| 11 | Male | Caucasian | 66 | 57 | Yes** |
| 12 | Male | Caucasian | 43 | 37 | No |
| 13 | Male | Caucasian | 63 | 61 | Yes** |
| 14 | Male | Caucasian | 46 | 40 | No |
| 15 | Male | Hispanic | 72 | 66 | No |
| 16 | Male | Caucasian | 64 | 52 | Yes* |
| 17 | Male | Caucasian | 76 | 69 | No |
| 18 | Male | Caucasian | 68 | 64 | Yes* |
| 19 | Male | Caucasian | 57 | 42 | No |
| 20 | Male | Caucasian | 60 | 59 | No |
1st degree relative
2nd degree relative
A spot urine sample of about 50 ml was collected from each participant and 1 mg/ml ascorbic acid was added to prevent oxidation of the catechol moieties in the various estrogen compounds. The urine samples were aliquoted and five 10-ml aliquots were stored at −80 °C until analysis. Thus, each analytical sample was thawed only once prior to analysis.
Solid phase extraction of urine
SPE method development and validation was previously described (Gaikwad et al 2008). Briefly, after adjusting 2-ml aliquots of urine to pH 7, they were loaded onto phenyl 100-mg cartridges pre-conditioned with methanol and the loading buffer, 10 mM ammonium formate, pH 7. The cartridges were washed with loading buffer, and then the compounds of interest were eluted from the cartridge by using an elution buffer, methanol/10 mM ammonium formate, pH 7 (90:10) with 1% acetic acid. The eluates from both the case and control samples were concentrated and subjected to ultraperformance liquid chromatography/tandem mass spectrometry (UPLC-MS/MS) analysis.
UPLC-MS/MS analysis of urine samples
All experiments were performed on a Waters (Milford, MA) Quattro Micro triple quadrupole mass spectrometer by using electrospray ionization (ESI) in positive ion (PI) and negative ion (NI) mode, with an ESI-MS capillary voltage of 3.0 kV, an extractor cone voltage of 2 V, and a detector voltage of 650 V. Desolvation and cone gas flow were maintained at 400 and 60 l/h, respectively. Desolvation temperature and source temperature were set to 200 and 100 °C, respectively. For all studies, a methanol:water (1:1) mixture with 0.1% formic acid was used as the carrier solution. The parent and daughter ion data obtained for all standard compounds were used to generate the multiple reaction monitoring (MRM) method for UPLC-MS/MS operation (Gaikwad et al 2008).
UPLC-MS/MS analyses of estrogen-related compounds (Table 2) in urine extracts were carried out with a Waters Acquity UPLC system connected with the high performance Quattro Micro triple quadrupole mass spectrometer. Analytical separations on the UPLC system were conducted using an Acquity UPLC BEH C18 1.7 μm column (1 × 100 mm) at a flow rate of 0.15 ml/min. The gradient started with 80% A (0.1% formic acid in water) and 20% B (0.1% formic acid in acetonitrile), changed to 79% A over 4 min, followed by a 6-min linear gradient to 45% A, resulting in a total separation time of 10 min. The elutions from the UPLC column were introduced to the Quattro Micro mass spectrometer. QuanLynx software (Waters) was used to quantify the estrogen metabolites, conjugates and DNA adducts, which were expressed as pmol/mg creatinine (Cr). Cr was also measured by mass spectrometry (Gaikwad et al 2008). Limit of detection and coefficient of variation for the UPLC-MS/MS method were presented earlier (Gaikwad et al 2008).
Table 2.
Representative metabolic profile of a urine sample obtained from a man with Parkinson’s disease.1
| No. | Compound | Total pmole/mg creatinine |
|---|---|---|
| 1 | Androstenedione | 2.6 |
|
| ||
| 2 | Testosterone | 1.1 |
|
| ||
| 3 | E1 Sulfate | 4.2 |
|
| ||
| 4 | E22 | 6.2 |
| 5 | E12 | |
|
| ||
| 6 | 2-OHE2 | 13.5 |
| 7 | 2-OHE1 | |
|
| ||
| 8 | 4-OHE2 | 8.8 |
| 9 | 4-OHE1 | |
|
| ||
| 10 | 16α-OHE2 | 71.6 |
| 11 | 16α-OHE1 | |
|
| ||
| 12 | 2-OCH3E2 | 38.2 |
| 13 | 2-OCH3E1 | |
|
| ||
| 14 | 4-OCH3E2 | 6.8 |
| 15 | 4-OCH3E1 | |
|
| ||
| 16 | 2-OH-3-OCH3E2 | 0.0 |
| 17 | 2-OH-3-OCH3E1 | |
|
| ||
| 18 | 2-OHE2-1-SG | 1.2 |
| 19 | 2-OHE2-4-SG | |
| 20 | 2-OHE1-1-SG | |
| 21 | 2-OHE1-4-SG | |
| 22 | 2-OHE2-1+4-Cys | |
| 23 | 2-OHE2-1-Cys | |
| 24 | 2-OHE1-4-Cys | |
| 25 | 2-OHE2-1-NAcCys | |
| 26 | 2-OHE2-4-NAcCys | |
| 27 | 2-OHE1-1-NAcCys | |
| 28 | 2-OHE1-4-NAcCys | |
|
| ||
| 29 | 4-OHE2-2-SG | 0.7 |
| 30 | 4-OHE1-2-SG | |
| 31 | 4-OHE2-2-Cys | |
| 32 | 4-OHE1-2-Cys | |
| 33 | 4-OHE2-2-NAcCys | |
| 34 | 4-OHE1-2-NAcCys | |
|
| ||
| 35 | 4-OHE2-1-N7Gua | 1.25 |
| 36 | 4-OHE1-1-N7Gua | |
|
| ||
| 37 | 4-OHE2-1-N3Ade | 0.48 |
| 38 | 4-OHE1-1-N3Ade | |
|
| ||
| 39 | 2-OHE2-6-N3Ade | 0.07 |
| 40 | 2-OHE1-6-N3Ade | |
|
| ||
| Ratio3 × 1000 | 106 | |
Typically, each 2-ml urine sample was analyzed at least 2 times. The data obtained from LC/MS-MS were processed and normalized to creatinine levels. Since the E1 and E2 derivatives are interconvertible, the total amount for each E1 plus E2 derivative in the various categories is presented and used for calculating the final ratio of depurinating adducts to their respective metabolites and conjugates.
Free E2 and E1 in the urine sample.
A batch of 10 random samples was run in triplicate during each UPLC-MS/MS analysis. For each batch of samples, pure standards were used to optimize the UPLC-MS/MS conditions prior to analysis and construct a calibration curve. In addition, for each batch, the standard mixture was run before the first sample, after the 5th sample and after the last (10th) sample to prevent errors due to matrix effect and day-to-day instrument variations. Immediately after the initial standard and before the first sample, two spiked samples were run to correct for the drift in the retention time of all estrogen-related compounds due to matrix effect. Each sample was analyzed in triplicate. After UPLC analysis, the mean value was calculated for all the compounds obtained from each sample; repeat analyses varied with 10%.
Statistical Analysis
Variables
Patients with PD were coded as a 1 and controls as a 0 so that those at increased odds of PD would show an odds ratio > 1.00. We used the ratio of depurinating N3Ade and N7Gua adducts to the sum of their respective estrogen metabolites and conjugates (see Table 2 for precise formula) as a summary measure of adduct formation because the ratio reflects the degree of imbalance in estrogen metabolism that can lead to toxicity. A logarithmic transformation was applied to the DNA adduct ratio in order to improve linearity of the variable in logistic regression models. Age was normally distributed and used as a continuous variable.
Statistical tests conducted
The levels of the four individual compounds and the adduct ratio were compared between PD cases and controls using medians and ranges because the compounds were not normally distributed. All bivariate analyses were conducted using the exact Wilcoxon two-sample test. Significant differences in age between cases and controls were tested using a two-sample t-test. We first tested whether men and women differed in their levels of the compounds and the adduct ratio to determine whether sex was a confounder on the relationship between each compound and the odds of being a PD case. Logistic regression models were used to assess the relationship between the adduct ratio and the odds of having PD, controlling for age and gender. Due to using the log transformed adduct ratio, the odds ratio for having PD is not associated with a one unit change in the level of the adduct ratio, but is an exponential function of both the slope coefficient and the log level of the ratio (Elswick et al 1997). Nonetheless, the odds ratio associated with levels of important catechol pathway products and PD provides a measure by which to estimate the effect size on the risk of PD. All analyses were carried out in SAS version 9.2, (SAS Institute, Cary, NC); confidence intervals (CI) and p-values are reported at the 95% level of significance.
RESULTS
An initial study of the possible relationship between formation of estrogen-DNA adducts and PD was conducted by analyzing the estrogen metabolites, conjugates and depurinating DNA adducts in urine samples from 20 patients, 15 male and 5 female, diagnosed with PD. The characteristics of the PD patients are presented in Table 1. The patients’ motor scores (UPDRSIII) averaged 17.2 ± 8.2 and their total UPDRS scores averaged 31.0 ± 16.3 (“The unified Parkinson’s” 2003). All of the PD patients were administered levodopa, 85% took a dopamine agonist, 25% were on a monoamine oxidase b inhibitor and 20% on a COMT inhibitor. Of the six subjects with a family history of PD, four had a first-degree relative with PD, and, thus, were considered to have familial PD. Two cases had a second-degree relative with PD and were considered to have sporadic PD. One case, #7 in Table 1 and Figure 3, had both first-degree and second-degree relatives diagnosed with PD.
Figure 3.

Ratio of depurinating estrogen-DNA adducts to their respective metabolites and conjugates in urine samples from healthy controls and cases with PD.
The relative levels of the estrogen-DNA adducts in these samples were compared to those in urine samples from 40 gender-matched male (30) and female (10) healthy controls (Figure 3). The mean ages (standard deviation) of cases and controls did not differ (PD cases: 62.3 ± 7.3 vs. Controls: 63.9 ± 12.3, p = 0.59). Of the compounds analyzed, only the thiol conjugates differed significantly by gender (medians: males = 3.11, females = 0.65, p = 0.0001); the adduct ratio did not significantly differ between men and women.
The forty estrogen-related compounds analyzed after partial purification of the urine samples by SPE are presented in Table 2. In the PD cases and the male and female healthy controls, the median levels of methoxy conjugates and thiol conjugates (GSH, Cys and NAcCys) were statistically significantly higher in the controls compared to the cases (p = 0.001 and p = 0.0002, respectively, Figures 2 and 4). This result suggests that greater formation of the methoxy and thiol conjugates provides a protective effect in relation to PD. In contrast, the median levels of the 4-OHE1(E2)-1-N3Ade (p = 0.005) and 4-OHE1(E2)-1-N7Gua (p = 0.004) adducts were significantly higher in the cases compared to the controls (Figures 2 and 5). No difference was found between the two groups for the median levels of the 2-OHE1(E2)-6-N3Ade adducts (p = 0.74), which were present at much lower levels (data not shown). None of the patient characteristics were statistically associated with the adduct ratio.
Figure 4.

Median levels of (A) 4-OCH3E1(E2) (p=0.001) and (B) 4-OHE1(E2)-thiol conjugates (GSH, Cys, NAcCys, p=0.0002) from PD cases and healthy controls.
Figure 5.

Median levels of (A) 4-OHE1(E2)-1-N7Gua (p=0.005) and (B) 4-OHE1(E2)-1-N3Ade (p=0.004) adducts from PD cases and healthy controls.
To find the balance between the activating and deactivating pathways in PD cases and healthy controls, the ratio of depurinating adducts to the sum of their respective estrogen metabolites and conjugates (see Table 2) was analyzed (Figures 2 and 6). The median ratio in the PD cases, 53.5, was significantly higher than the median ratio in the controls, 25 (p = 0.008). In the ratio of adducts to their respective metabolites and conjugates, the preponderant role is played by the N3Ade and N7Gua adducts of 4-OHE1(E2), whereas the N3Ade adducts of 2-OHE1(E2) play a very minor role.
Figure 6.
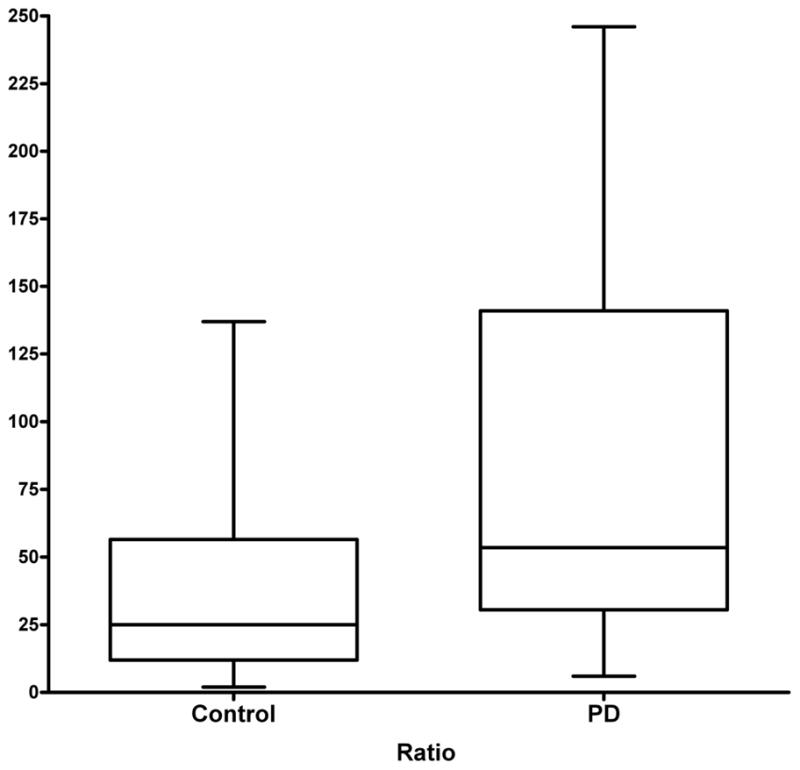
Median ratios of depurinating estrogen-DNA adducts to the sum of their corresponding estrogen metabolites and conjugates in PD cases and healthy controls (p=0.008).
An increase in the adduct ratio from 50 to 100 translates into a 2-fold increase in the odds of being a PD case. Using an unadjusted model, the odds ratio (OR, 95% CI) for the DNA adduct ratio in cases vs controls was 2.26 (1.22, 4.19). As expected, after adjusting for age and gender, the OR (95% CI) for the DNA adduct ratio in cases vs controls was 2.34 (1.25, 4.36). Thus, neither age nor sex significantly altered the OR calculated from these results. In summary, PD patients have significantly higher levels of depurinating estrogen-DNA adducts in their urine than do healthy control men and women.
DISCUSSION
A number of different mechanisms have been proposed in the etiology of PD, but none has been thought to have absolute predominance. Based on resemblance, activity and location of catechol estrogens and DA, we hypothesize that the catechol estrogen quinones could, along with DA-Q, be responsible for initiation of PD (Figure 1).
Catechol estrogens are thought to become bioactivated and act as endogenous carcinogens through the intermediacy of catechol estrogen quinones (Cavalieri et al 2006, Gaikwad et al 2008, Gaikwad et al 2009a,b, Yang et al 2009, Cavalieri & Rogan 2010). These quinones are demonstrated to react with DNA to form predominantly depurinating 4-OHE1(E2)-1- N3Ade and 4-OHE1(E2)-1-N7Gua adducts (Cavalieri et al 1997, Li et al 2004). Due to their structural features, these adducts depurinate, forming abasic sites in DNA. Error-prone repair of the abasic sites has been established to be a primary cause of mutations that are critical for cancer initiation (Cavalieri et al 2006). Thus, catechol estrogens, particularly 4-OHE1(E2), that lead to the formation of depurinating adducts could be responsible for induction of mutations in the α-synuclein, parkin, UCH-L1 and/or LRRK2 genes.
Catechol estrogen metabolism involves a balance between activating and deactivating pathways (Cavalieri et al 2006, Gaikwad et al 2008, Gaikwad et al 2009a,b, Yang et al 2009), which are depicted in Figure 2. Activating pathways lead to formation of depurinating DNA adducts, whereas protective pathways minimize oxidation of catechol estrogens to quinones, and their subsequent reaction with DNA (Figure 2). Minimization occurs by two-electron reduction of quinones to catechols, methoxylation of catechols, and conjugation of quinones. In this case-control study, we have examined urinary profiles of cases with PD and healthy controls. Comparison of the estrogen metabolic profiles of these two groups clearly shows the median 4-OCH3E1(E2) and 4-OHE1(E2)-thiol conjugate (GSH, Cys, NAcCys) values were higher for controls compared with PD cases (Figure 4). In contrast, the median 4-OHE1(E2)-1-N3Ade and 4-OHE1(E2)-1-N7Gua values were higher in PD cases compared to controls (Figure 5). This suggests that in control subjects, estrogen metabolism is balanced, i.e. the levels of estrogen-DNA adducts are low and/or the levels of estrogen metabolites and conjugates are high. In subjects with PD, however, the estrogen metabolism is unbalanced, i.e. the levels of depurinating estrogen-DNA adducts are high and/or the levels of estrogen metabolites and conjugates are low. The observation of high levels of depurinating estrogen-DNA adducts in urine from cases with PD (Figure 5) is consistent with the hypothesis that these adducts may be a causative factor in the etiology of PD. The median 2-OCH3 E1(E2) and 2-OHE1(E2)-6-N3Ade values in both groups did not show any trend, indicating that this pathway may not be an important factor in PD. Furthermore, the analysis of DNA adduct ratios was carried out to quantify the degree of imbalance in the estrogen metabolism. The ratios obtained for cases with PD are found to be higher, while the ratio levels for the healthy control samples remained lower (Figure 6). The higher ratio value reflects the higher levels of DNA adducts in urine of patients with PD. These results suggest that high levels of estrogen-DNA adducts may be an important determinant of PD initiation. However, further studies are needed to confirm this finding, although given the effect size for the DNA adduct ratio, we calculated that we had greater than 97% power to detect the two-fold increased risk we found with one unit increase in the adduct ratio.
As presented in Figure 1, at neutral pH DA-Q undergoes intramolecular cyclization in which the nucleophilic amino group by 1,4-Michael addition forms the bicyclic compound called leukochrome. This is further oxidized to aminochrome, which cyclizes to form neuromelanin. When the pH of the environment decreases to 6 or below, an intermolecular 1,4-Michael addition between DA-Q and DNA becomes competitive with the intramolecular cyclization (Figure 1). In this case, formation of the depurinating adducts DA-6-N3Ade and DA-6-N7Gua occurs (Figure 1) (Zahid et al 2011). The apurinic sites thus formed in the DNA can generate mutations that could lead via several steps to neurodegeneration. This is analogous to the mechanism of metabolic activation of the estrogens in which E1(E2)-3,4-Q react with DNA to form the 4-OHE1(E2)-1-N3Ade and 4-OHE1(E2)-1-N7Gua adducts (Figure 1) (Cavalieri & Rogan 2010).
Recently, R. H. Edwards and his colleagues (Hnasko et al 2010) reported that excessive amounts of glutamate can result in a lumenal pH of 5.5 in dopaminergic neurons. Under these conditions DA-Q could react with mitochondrial or nuclear DNA to form the depurinating DA-DNA adducts.
In summary, the levels of estrogen metabolites, conjugates and depurinating DNA adducts differ significantly between healthy controls and cases with PD. The ratios of depurinating DNA adducts to their respective estrogen metabolites and conjugates were significantly associated with health status. The PD cases have relatively high levels of estrogen-DNA adducts in their urine. Our results are consistent with the hypothesis that formation of estrogen-DNA adducts could be one of the critical events in the initiation of PD. It is possible that critical mutations generated by specific DNA damage could result in neuronal degeneration. Taken together, these results are consistent with the hypothesis that catechol estrogen quinones, along with dopamine quinone, could initiate PD through their genotoxicity.
Acknowledgments
This research was supported by Prevention LLC. Core support at the Eppley Institute was provided by grant P30 36727 from the National Cancer Institute.
Footnotes
DECLARATION OF INTEREST
The authors report no declarations of interest.
References
- Banger M, Hiemke C, Knuppen R, Ball P, Haupt M, Wiedemann K. Formation and metabolism of catechol estrogens in depressed patients. Biol Psychiatry. 1990;28:685–96. doi: 10.1016/0006-3223(90)90455-b. [DOI] [PubMed] [Google Scholar]
- Bisaglia M, Mammi S, Bubacco L. Kinetic and structural analysis of the early oxidation products of dopamine: analysis of the interactions with α-synuclein. J Biol Chem. 2007;282:15597–605. doi: 10.1074/jbc.M610893200. [DOI] [PubMed] [Google Scholar]
- Brice A. Genetics of Parkinson’s disease: LRRK2 on the rise. Brain. 2005;128:2760–2. doi: 10.1093/brain/awh676. [DOI] [PubMed] [Google Scholar]
- Cao K, Stack DE, Ramanathan R, Gross ML, Rogan EG, Cavalieri EL. Synthesis and structure elucidation of estrogen quinones conjugated with cysteine, N-acetylcysteine, and glutathione. Chem Res Toxicol. 1998;11:909–16. doi: 10.1021/tx9702291. [DOI] [PubMed] [Google Scholar]
- Cavalieri EL, Li K-M, Balu N, Saeed M, Devanesan P, Higginbotham S, Zhao J, Gross ML, Rogan EG. Catechol ortho-quinones: The electrophilic compounds that form depurinating DNA adducts and could initiate cancer and other diseases. Carcinogenesis. 2002;23:1071–7. doi: 10.1093/carcin/23.6.1071. [DOI] [PubMed] [Google Scholar]
- Cavalieri E, Chakravarti D, Guttenplan J, Hart E, Ingle J, Jankowiak R, Muti P, Rogan E, Russo J, Santen R, Sutter T. Catechol estrogen quinones as initiators of breast and other human cancers: implications for biomarkers of susceptibility and cancer prevention. Biochim Biophys Acta, Reviews on Cancer. 2006;1766:63–78. doi: 10.1016/j.bbcan.2006.03.001. [DOI] [PubMed] [Google Scholar]
- Cavalieri EL, Rogan EG. Depurinating estrogen-DNA adducts in the etiology and prevention of breast and other human cancers. Future Oncology. 2010;6:75–91. doi: 10.2217/fon.09.137. [DOI] [PMC free article] [PubMed] [Google Scholar]
- Chinta SJ, Andersen JK. Redox imbalance in Parkinson’s disease. Biochim Biophys Acta, General Subjects. 2008;1780:1362–7. doi: 10.1016/j.bbagen.2008.02.005. [DOI] [PMC free article] [PubMed] [Google Scholar]
- Cookson MR, van der Brug M. Cell systems and the toxic mechanism(s) of α-synuclein. Exp Neurol. 2008;209:5–11. doi: 10.1016/j.expneurol.2007.05.022. [DOI] [PMC free article] [PubMed] [Google Scholar]
- Dauer W, Przedborski S. Parkinson’s disease: mechanisms and models. Neuron. 2003;39:889–909. doi: 10.1016/s0896-6273(03)00568-3. [DOI] [PubMed] [Google Scholar]
- Deumens R, Blokland A, Prickaerts J. Modeling Parkinson’s disease in rats: an evaluation of 6-OHDA lesions of the nigrastriatal pathway. Exp Neurol. 2002;175:303–17. doi: 10.1006/exnr.2002.7891. [DOI] [PubMed] [Google Scholar]
- Elswick RK, Jr, Schwartz PF, Welsh JA. Interpretation of the odds ratio from logistic regression after a transformation of the covariate vector. Stat Med. 1997;16:1695–703. doi: 10.1002/(sici)1097-0258(19970815)16:15<1695::aid-sim601>3.0.co;2-v. [DOI] [PubMed] [Google Scholar]
- Gaikwad NW, Rogan EG, Cavalieri EL. Evidence by ESI-MS for NQO1-catalyzed reduction of estrogen ortho-quinone. Free Radic Biol Med. 2007;43:1289–98. doi: 10.1016/j.freeradbiomed.2007.07.021. [DOI] [PMC free article] [PubMed] [Google Scholar]
- Gaikwad NW, Yang L, Muti P, Meza JL, Pruthi S, Ingle JN, Rogan EG, Cavalieri EL. The molecular etiology of breast cancer: evidence from biomarkers of risk. Int J Cancer. 2008;122:1949–57. doi: 10.1002/ijc.23329. [DOI] [PMC free article] [PubMed] [Google Scholar]
- Gaikwad NW, Yang L, Pruthi S, Ingle JN, Rogan EG, Cavalieri EL. Urinary biomarkers of risk in the etiology of breast cancer. Breast Cancer: Basic and Clinical Research. 2009a;3:1–8. doi: 10.4137/bcbcr.s2112. [DOI] [PMC free article] [PubMed] [Google Scholar]
- Gaikwad N, Yang L, Weisenburger DD, Vose J, Beseler C, Rogan E, Cavalieri E. Urinary biomarkers suggest that estrogen-DNA adducts may play a role in the aetiology of non-Hodgkin lymphoma. Biomarkers. 2009b;14:502–12. doi: 10.3109/13547500903121715. [DOI] [PMC free article] [PubMed] [Google Scholar]
- Gaikwad NW, Yang L, Rogan EG, Cavalieri L. Evidence for NQO2-mediated protection against carcinogenic estrogen ortho-quinones. Free Radic Biol Med. 2009c;46:553–62. doi: 10.1016/j.freeradbiomed.2008.10.029. [DOI] [PMC free article] [PubMed] [Google Scholar]
- Gasser T. Parkin and its role in Parkinson’s disease. Parkinson’s Disease. 2005:129–37. [Google Scholar]
- Gelb DJ, Oliver E, Gilman S. Diagnostic criteria for Parkinson disease. Arch Neurol. 1999;56:33–9. doi: 10.1001/archneur.56.1.33. [DOI] [PubMed] [Google Scholar]
- Gong B, Leznik E. The role of ubiquitin C-terminal hydrolase L1 in neurodegenerative disorders. Drug News Perspect. 2007;20:365–70. doi: 10.1358/dnp.2007.20.6.1138160. [DOI] [PubMed] [Google Scholar]
- Harada S, Fujii C, Hayashi A, Norio Ohkoshi. An association between idiopathic Parkinson’s disease and polymorphisms of phase II detoxification enzymes: glutathione S-transferase M1 and quinone oxidoreductase 1 and 2. Biochem Biophys Res Commun. 2001;288:887–92. doi: 10.1006/bbrc.2001.5868. [DOI] [PubMed] [Google Scholar]
- Hatcher JM, Pennell KD, Miller GW. Parkinson’s disease and pesticides: a toxicological perspective. Trends Pharmacol Sci. 2008;29:322–9. doi: 10.1016/j.tips.2008.03.007. [DOI] [PMC free article] [PubMed] [Google Scholar]
- Henchcliffe C, Beal MF. Mitochondrial biology and oxidative stress in Parkinson disease pathogenesis. Nat Clin Pract Neurol. 2008;4:600–9. doi: 10.1038/ncpneuro0924. [DOI] [PubMed] [Google Scholar]
- Hnasko TS, Chuhma N, Zhang H, Goh GY, Sulzer D, Palmiter RD, Rayport S, Edwards RH. Vesicular glutamate transport promotes dopamine storage and glutamate corelease in vivo. Neuron. 2010;65:643–56. doi: 10.1016/j.neuron.2010.02.012. [DOI] [PMC free article] [PubMed] [Google Scholar]
- Huang Z, de la Fuente-Fernandez R, Stoessl AJ. Etiology of Parkinson’s disease. Can J Neurol Sci. 2003;30(Suppl I):S10–8. doi: 10.1017/s031716710000319x. [DOI] [PubMed] [Google Scholar]
- Kitada T, Asakawa S, Hattori N, Matsumine H, Yamamura Y, Minoshima S, Yokochi M, Mizuno Y, Shimizu N. Mutations in the parkin gene cause autosomal recessive juvenile parkinsonism. Nature. 1998;392:605–8. doi: 10.1038/33416. [DOI] [PubMed] [Google Scholar]
- Lang AE, Lozano AM. Parkinson’s disease. First of two parts. N Eng J Med. 1998;339:1044–53. doi: 10.1056/NEJM199810083391506. [DOI] [PubMed] [Google Scholar]
- Leroy E, Boyer R, Auburger G, Leube B, Ulm G, Mezey E, Harta G, Brownstein MJ, Jonnalagada S, Chernova T, Dehejia A, Lavedan C, Gasser T, Steinbach PJ, Wilkinson KD, Polymeropoulos MH. The ubiquitin pathway in Parkinson’s disease. Nature. 1998;395:451–2. doi: 10.1038/26652. [DOI] [PubMed] [Google Scholar]
- Levay G, Ye Q, Bodell WJ. Formation of DNA adducts and oxidative base damage by copper mediated oxidation of dopamine and 6-hydroxydopamine. Exp Neurol. 1997;146:570–4. doi: 10.1006/exnr.1997.6560. [DOI] [PubMed] [Google Scholar]
- Li KM, Todorovic R, Devanesan P, Higginbotham S, Kofeler H, Ramanathan R, Gross ML, Rogan EG, Cavalieri EL. Metabolism and DNA binding studies of 4-hydroxyestradiol and estradiol-3,4-quinone in vitro and in female ACI rat mammary gland in vivo. Carcinogenesis. 2004;25:289–97. doi: 10.1093/carcin/bgg191. [DOI] [PubMed] [Google Scholar]
- Maguire-Zeiss KA, Short DW, Federoff HJ. Synuclein, dopamine and oxidative stress: co-conspirators in Parkinson’s disease? Brain Res Mol Brain Res. 2005;134:18–23. doi: 10.1016/j.molbrainres.2004.09.014. [DOI] [PubMed] [Google Scholar]
- Maries E, Dass B, Collier TJ, Kordower JH, Steece-Collier K. The role of α-synuclein in Parkinson’s disease: insights from animal models. Nat Rev Neurosci. 2003;4:727–38. doi: 10.1038/nrn1199. [DOI] [PubMed] [Google Scholar]
- Mitamura K, Yatera M, Shimada K. Studies on neurosteroids. Part XIII. Characterization of catechol estrogens in rat brains using liquid chromatography-mass spectrometry-mass spectrometry. Analyst. 2000;125:811–4. doi: 10.1039/b001437k. [DOI] [PubMed] [Google Scholar]
- Mizuno Y, Hattori N, Kitada T, Matsumine H, Mori H, Shimura H, Kubo S, Kobayashi H, Asakawa S, Minoshima S, Shimizu N. Familial Parkinson’s disease: α-synuclein and parkin. Adv Neurol. 2001;86:13–21. [PubMed] [Google Scholar]
- Paisan-Ruiz C, Jain S, Evans EW, Gilks WP, Simon J, van der Brug M, et al. Cloning of the gene containing mutations that cause PARK8-linked Parkinson’s disease. Neuron. 2004;44:595–600. doi: 10.1016/j.neuron.2004.10.023. [DOI] [PubMed] [Google Scholar]
- Parvizi N, Ellendorff F. Catecholestrogens in the brain: neuroendocrine integration. J Steroid Biochem. 1983;19:615–8. doi: 10.1016/0022-4731(83)90226-1. [DOI] [PubMed] [Google Scholar]
- Saeed M, Zahid M, Rogan E, Cavalieri E. Synthesis of the catechols of natural and synthetic estrogens by using 2-iodoxybenzoic acid (IBX) as the oxidizing agent. Steroids. 2005;70:173–8. doi: 10.1016/j.steroids.2004.11.005. [DOI] [PubMed] [Google Scholar]
- Shastry BS. Molecular etiology of Parkinson disease. Recent progress. Neuroscientist. 2000;6:234–240. [Google Scholar]
- Stack D, Byun J, Gross ML, Rogan EG, Cavalieri E. Molecular characteristics of catechol estrogen quinones in reactions with deoxyribonucleosides. Chem Res Toxicol. 1996;9:851–9. doi: 10.1021/tx960002q. [DOI] [PubMed] [Google Scholar]
- Steece-Collier K, Maries E, Kordower JH. Etiology of Parkinson’s disease: genetics and environment revisited. Proc Natl Acad Sci USA. 2002;99:13972–4. doi: 10.1073/pnas.242594999. [DOI] [PMC free article] [PubMed] [Google Scholar]
- Tanner CM. Is the cause of Parkinson’s disease environmental or hereditary? Evidence from twin studies. Adv Neurol. 2003;91:133–42. [PubMed] [Google Scholar]
- The unified Parkinson’s disease rating scale (UPDRS): status and recommendations. Mov Disord. 2003;18:738–50. doi: 10.1002/mds.10473. [DOI] [PubMed] [Google Scholar]
- Yang L, Gaikwad NW, Meza J, Cavalieri EL, Muti P, Trock B, Rogan EG. Novel biomarkers for the risk of prostate cancer: Results from case-control study. Prostate. 2009;69:41–8. doi: 10.1002/pros.20850. [DOI] [PMC free article] [PubMed] [Google Scholar]
- Zafar KS, Inayat-Hussain SH, Siegel D, Bao A, Shieh B, Ross D. Overexpression of NQO1 protects human SK-N-MC neuroblastoma cells against dopamine-induced cell death. Toxicol Lett. 2006;166:261–7. doi: 10.1016/j.toxlet.2006.07.340. [DOI] [PubMed] [Google Scholar]
- Zahid M, Kohli E, Saeed M, Rogan E, Cavalieri E. The greater reactivity of estradiol-3,4-quinone versus estradiol-2,3-quinone with DNA in the formation of depurinating adducts. Implications for tumor-initiating activity. Chem Res Toxicol. 2006;19:164–72. doi: 10.1021/tx050229y. [DOI] [PubMed] [Google Scholar]
- Zahid M, Saeed M, Yang L, Rogan E, Cavalieri EL. Proposed role of dopamine quinone-DNA adducts in the etiology of Parkinson’s disease. 2011 doi: 10.1002/iub.538. Submitted. [DOI] [PMC free article] [PubMed] [Google Scholar]
- Zimprich A, Biskup S, Leitner P, Lichtner P, Farrer M, Lincoln S, et al. Mutations in LRRK2 cause autosomal-dominant parkinsonism with pleomorphic pathology. Neuron. 2004;44:601–7. doi: 10.1016/j.neuron.2004.11.005. [DOI] [PubMed] [Google Scholar]