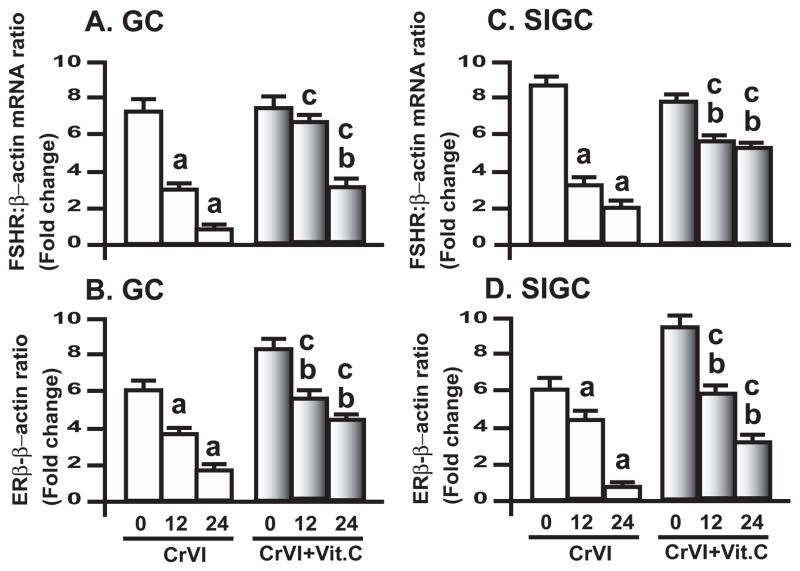
Fig. 9. Effect of CrVI on FSHR and ERβ in GC and SIGC.
GC and SIGC were pre-treated with or without vitamin C (1 mM) for 24 h and treated with CrVI (10 μM) for 0 h, 12 h and 24 h period. Total RNA was isolated and real-time qPCR was performed as described in Materials and Methods section. Histograms showing A, FSHR mRNA levels in GC; B, ERβ mRNA levels in GC; C, FSHR mRNA levels in SIGC; D, ERβ mRNA levels in SIGC. The fold differences were calculated by normalizing the relative expression of gene of interest with β-actin and the results were expressed as fold changes. Each value is the mean ± SEM from 3 different plates per treatment, P<0.05; a: CrVI-treatment, 0 h vs 12 h or 24 h; b: Vitamin C vs CrVI+Vitamin C-treatment, 0 h vs 12 h or 24 h; c: CrVI (12 h or 24 h) vs CrVI+Vitamin C (12 h or 24 h).

