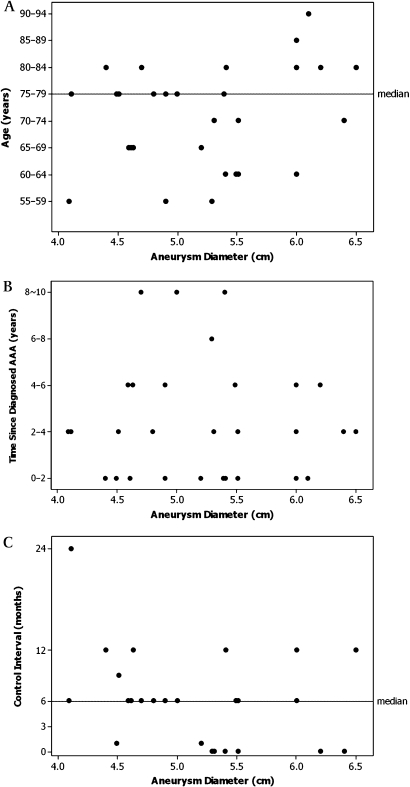
Figure 2.
(A) Scatter plot of age against aneurysm diameter. (B) Scatter plot illustrating the time since first diagnosis of abdominal aortic aneurysm (patient-reported) against aneurysm diameter. (C) Scatter plot illustrating the time to the next episode of monitoring against aneurysm diameter. Code value ‘0’ means that the patient was scheduled for operation. (The plot excludes two patients terminating the abdominal aortic aneurysm surveillance programme, and two patients without available data).

