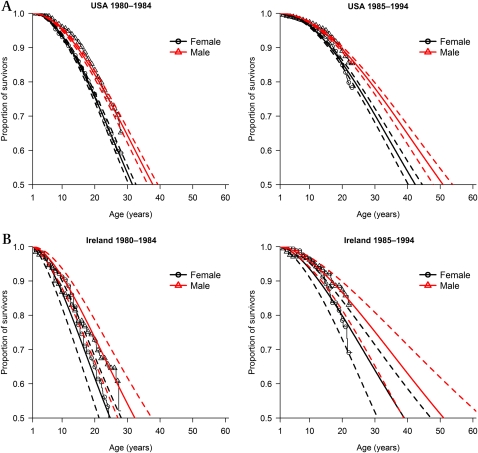
Figure 2.
Kaplan–Meier survivorship curves (females = ○, males = ∆) with fitted Weibull model with main effects of gender (female = black line, male = red line) and birth cohort and corresponding 95% CIs (dashed lines) for patients with cystic fibrosis surviving their first birthday and enrolled on the US Cystic Fibrosis Foundation Patient Registry (A) and the Cystic Fibrosis Registry of Ireland (B).

