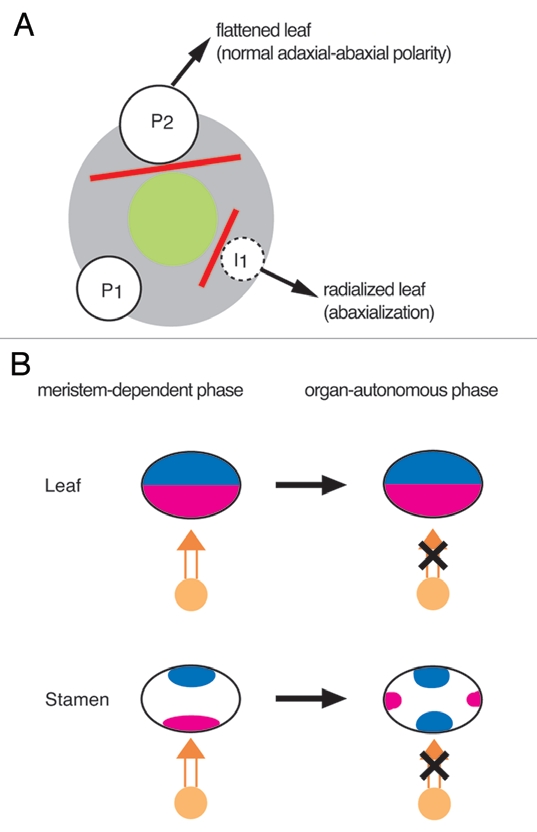
Figure 2.

Detection of the meristem-dependent and organ-autonomous phases. (A) Schematic representation of surgical experiments in leaf development. The green circle represents the center of the shoot apical meristem. Red solid lines represent incisions to isolate the primordium from the center of the meristem. (B) Schematic representations of the phase transition in the development of the leaf (upper part) and the stamen (lower part). A clear phase transition is detected in stamen development by the rearrangement of the expression patterns of the adaxial and abaxial markers, whereas no apparent change is observed in leaf development. Orange circles and orange arrows represent the meristem and a putative signal from the meristem, respectively. The adaxial and abaxial domains are shown in red and blue, respectively.
