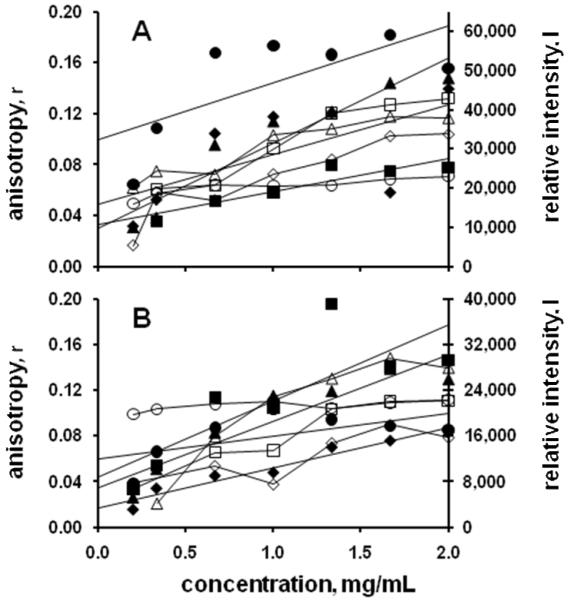
Figure 2.
Measured anisotropy (open symbols) and intensity values (closed symbols) for the model protein canavalin. Panel A shows data for cases where the plate outcome was a precipitate, but where the conditions were optimized to obtain crystals on the basis of the fluorescence data. Legend: ◇, condition A9; □, condition B3; △, condition D10, ○, condition H3. Panel B shows data for cases where the plate outcome was a clear solution, but crystals were obtained by increasing the protein concentration. Legend: ◇, condition A12; □, condition C2; △, condition D2; ○, condition G7.

