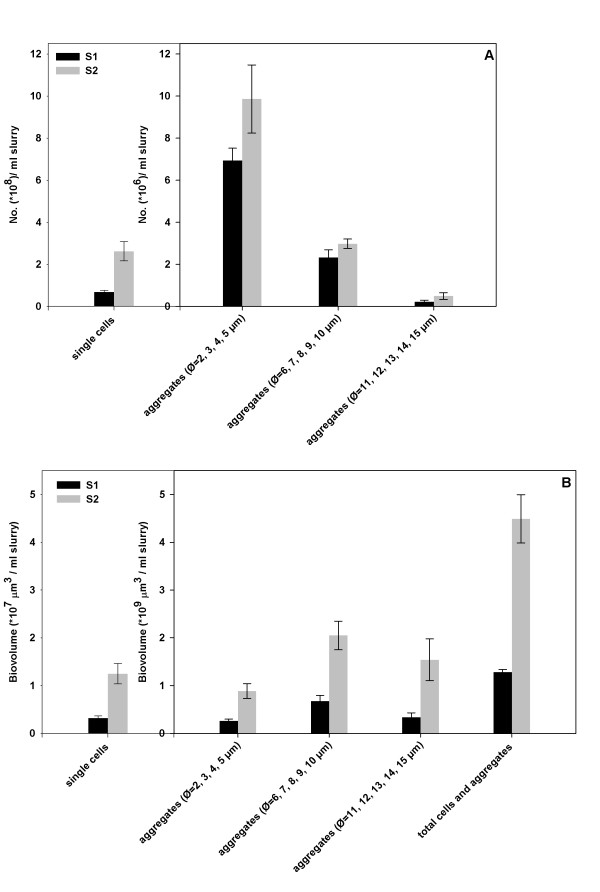
Figure 1.
Numbers of cells and aggregates (A) and the biovolume of cells and aggregates (B) in S1 and S2. The average value and standard error were calculated from 4 individual staining for each sample. For each staining 50 fields of view were counted for calculation. Note that the y axe scale is different for single cells.

