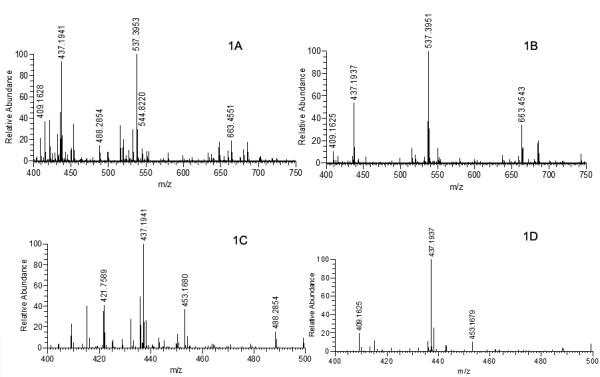
Figure 1.

LTQ-FT-ICR-MS spectra of tryptic digests from a single gel spot scanned across different m/z ranges. Fig. 1A, Tryptic digest sample scanned from 400-750 m/z range. Fig. 1B, same tryptic digest sample scanned from 400-2000 m/z range, spectrum shown zoomed to 400-750 m/z. Fig. 1C & 1D, spectra of A and B zoomed to the range of 400-500 m/z.
