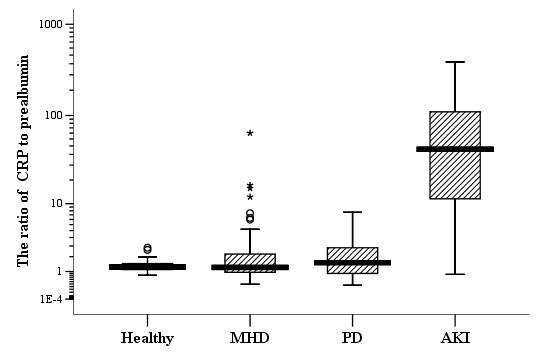
Figure 3.

Levels of the ratio of CRP to prealbumin in different populations. Healthy (n = 45); MHD: maintenance hemodialysis (n = 70); PD: peritoneal dialysis (n = 50); AKI: acute kidney injury (n = 155). The units of CRP and prealbumin were both mg/dL. Mann-Whitney U test was used for comparison between the populations, p < 0.001. Horizontal bars indicate 10th, 25th, 50th (median), 75th, and 90th percentile levels.
