
Figure 3.
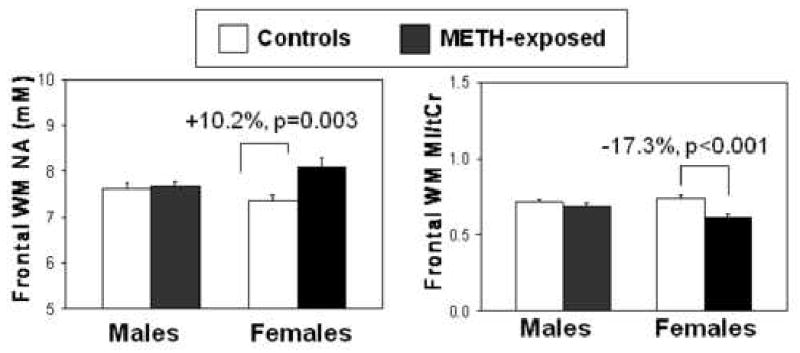
Bargraphs showing higher NA and lower MI/tCr only in the frontal white matter of the girls, but not the boys, exposed to METH (boys: n=23; girls: n=10) compared to those unexposed to the drug (boys: n=16, girls: n=15). METH-exposed x sex interaction: (NA, p=0.011; MI/tCr, p=0.03).