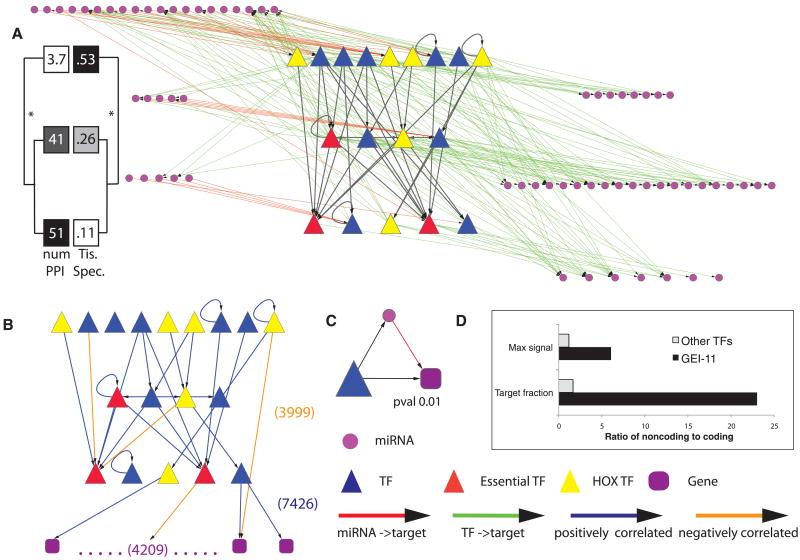
Fig. 3.
Integrated miRNA-TF regulatory network. (A) TFs are organized hierarchically, and those miRNAs either regulating or being regulated by the TFs are shown. (TF names are in fig S36.) All larval TF-TF interactions in HOT regions were removed. Tissue specificity and number of protein-protein interactions are shown for each of the hierarchical levels (6). (B) TF network after filtering out edges that do not show a significant correlation in their expression patterns. Also shown is a schematic representation of the target genes of the 18 larval TFs. (C) One of the three significantly enriched network motifs (other two are in fig. S37). (D) Enrichment of binding targets and signal of TFs in noncoding versus coding genes. Max signal equals the ratio of maximum binding signal of a TF at noncoding versus coding genes. Target fraction represents the ratio of target percentage in noncoding genes to that in coding genes (fig. S22A).

