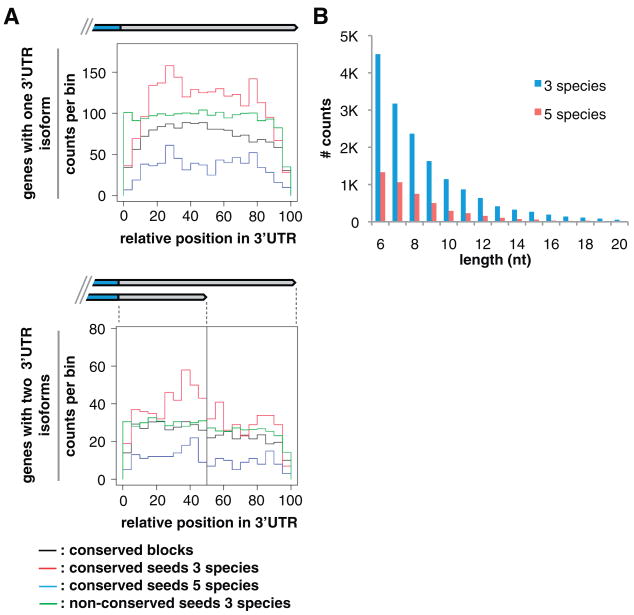
Fig. 3.
Conserved sequence elements in 3′UTRs. (A) Histogram distributions of conserved sequence blocks (black, counts shown at 1/5th scale), conserved miRNA seeds in three (red; C. elegans, C. remanei, C. briggsae) and five (blue; C. elegans, C. remanei, C. briggsae, C. brenneri, C. japonica) species, and nonconserved miRNA seeds (green, 1/25th scale) along the normalized length of 3′UTRs, in genes with one isoform (top) or exactly two isoforms (bottom). For genes with one isoform, the length scale is 100%; for two isoforms, 0 to 50% represents the short-isoform span, and 51 to 100% indicates the span exclusive to the long isoform. Counts were binned by fraction of total length and, thus, varied in absolute length. (B) Length distribution (up to 20 nt) of conserved sequence blocks in 3′UTRs (excluding miRNA target and PAS sites), in three (blue; n = 16,204 conserved blocks) and five (red; n = 4758) species. See also table S7.

