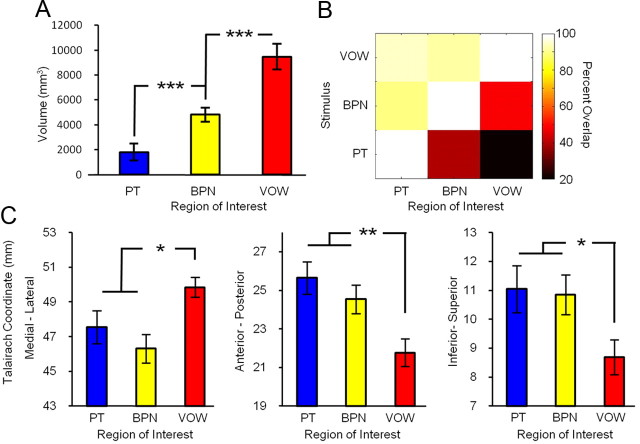
Figure 4.
Quantification of single-subject analysis. A, Activation volume by stimulus condition across subjects. B, Quantification of the spatial overlap between stimulus conditions. Matrix values indicate the percentage of voxels within the region of interest displayed along the horizontal axis that are also activated by the conditions shown along the vertical axis. Dark colors indicate a low percentage of overlap between conditions (i.e., few active voxels in common), while light colors indicate a high percentage of overlap. C, Average location of active voxels for each condition across subjects (medial–lateral coordinates are reported as absolute values because both hemispheres were collapsed). *p < 0.05, **p < 0.01, ***p < 0.001.

