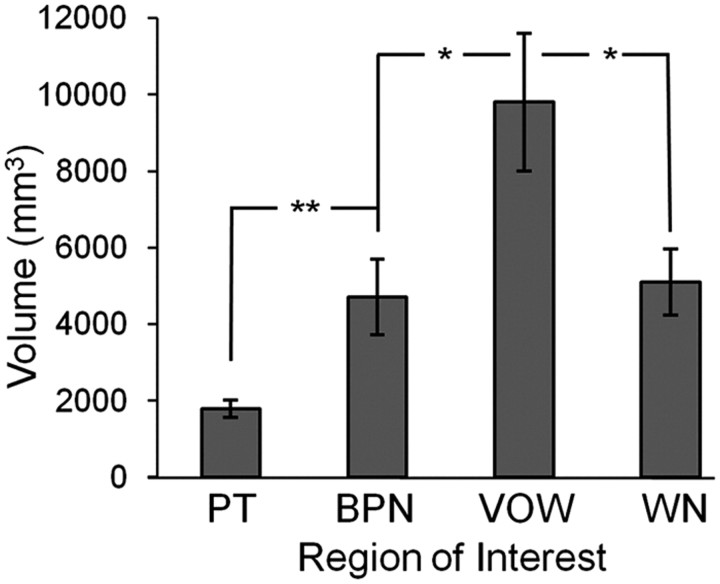
Figure 6.
Organization based on spectral complexity. In an additional control experiment activation by WN was compared with activation by PT, BPN, and VOW. The results demonstrate that the regional differences do not merely depend on increasing bandwidth, but depend instead on spectral complexity, similar to the monkey. Activation volume across subjects (n = 7) for each stimulus condition is shown. Minimum t values for each subject are those listed in Table 2. *p < 0.05, **p < 0.01, ***p < 0.001.

