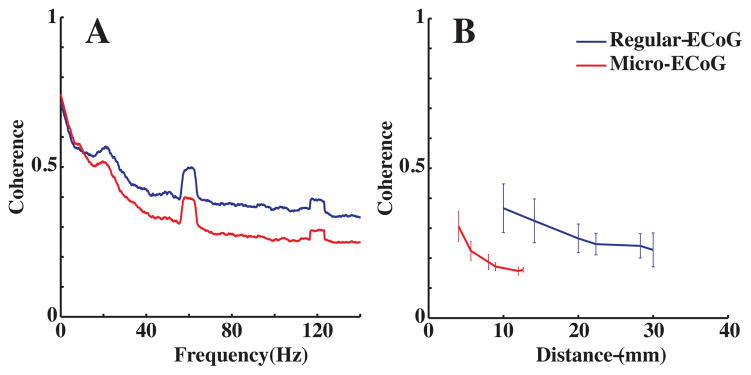
Fig. 2.
Coherence analysis for the micro-ECoG grid (red lines) and the regular grid (blue lines). 2A (left): Averaged coherence between neighboring electrodes. 2B (right): Coherence as a function of distance between electrodes. Error bars are standard deviations. Coherence values were calculated at all possible inter-electrode distances given the geometric configurations of the electrodes on the grids.

