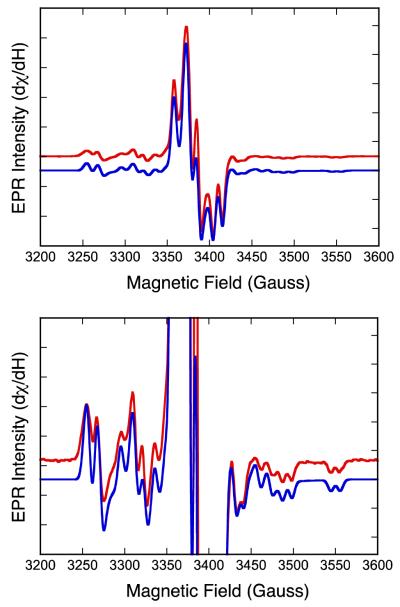
Figure 2.
Top: X-band EPR of the “high-g split” resonance observed for the DMSOR intermediate with (CH3)3NO as substrate (red) and spectral simulation (blue). Bottom: Expanded y-axis view of Top spectrum showing splitting due to 95,97Mo and 1H nuclei. Spectral parameters are given in Table 1.

