Figure 6.

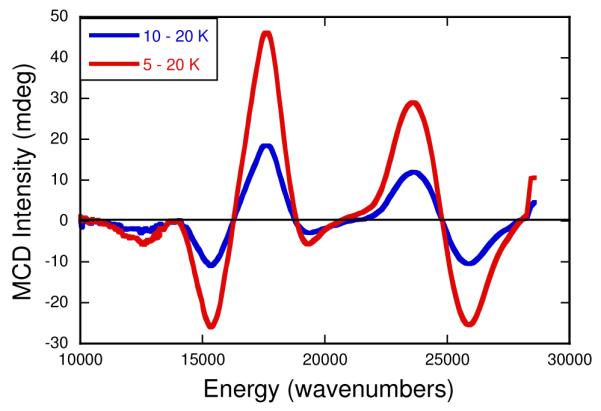
Variable-temperature MCD data for the physiological “high-g split” Mo(V) species (IMo(V)). The data, which were collected at 7T, are displayed as 5-20K (red) and 10-20K (blue) difference spectra.

Variable-temperature MCD data for the physiological “high-g split” Mo(V) species (IMo(V)). The data, which were collected at 7T, are displayed as 5-20K (red) and 10-20K (blue) difference spectra.