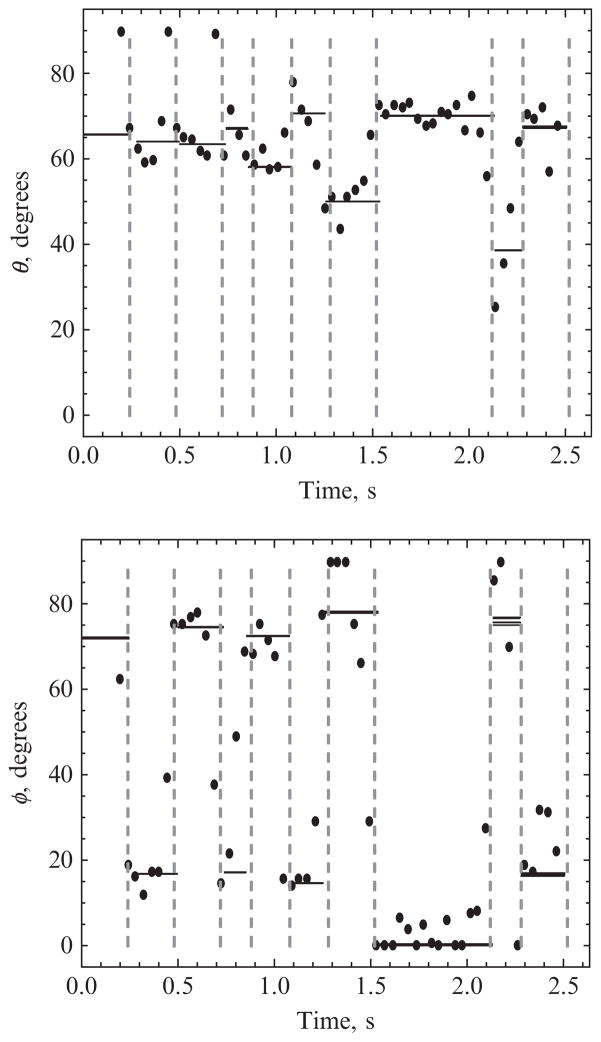
Figure 15.2.
Application of changepoint analysis to experimental data on the motions of the molecular motor myosin V. Dots show polar (θ) and azimuthal (φ) angles of a fluorescent probe attached to one lever arm of the motor inferred from photon rates obtained by the traditional time-binned method. The angles are defined in a system whose polar axis is the optical axis of the microscope. There are many outlier points, in part reflecting transitions that occur in the middle of a time bin. Solid lines show those same angles inferred from all the photons that lie between successive changepoints (dashed lines), indicating a clear alternating stride between well-defined values of φ. For each state, five lines are drawn to indicate the uncertainty in the fit angles, as described in Section 3.4. Generally, these lines are too close to distinguish.

