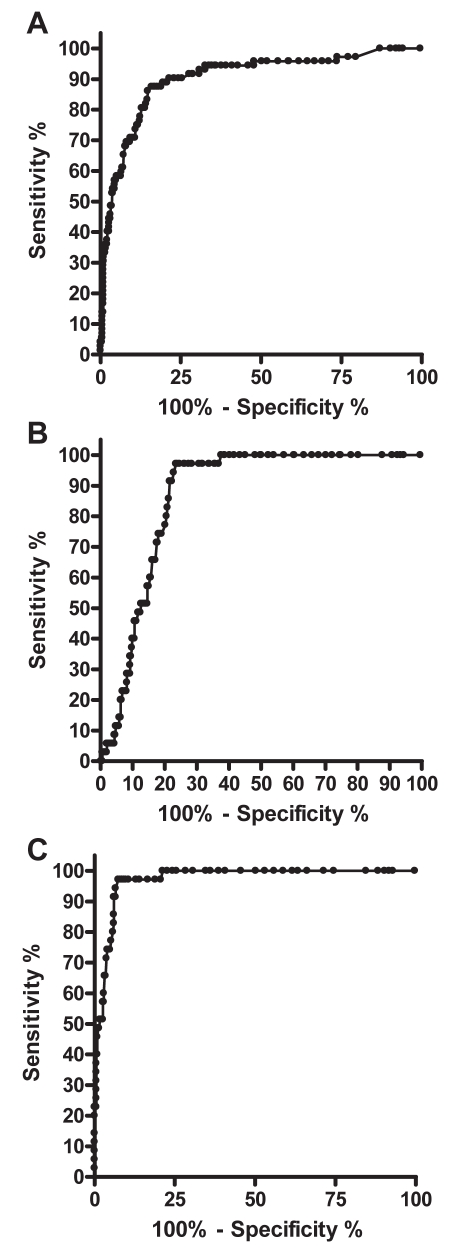
Figure 1).
ROC curves. A Type 1 bile acid malabsorption syndrome (BAM) (all other patients as controls). Area under ROC curve = 0.90; 95% CI 0.86 to 0.94; P<0.0001. B Type 2 BAM (all other patients as controls). Area under ROC curve = 0.87; 95% CI 0.83 to 0.90; P<0.0001. C Type 2 BAM (all irritable bowel syndrome patients as controls). Area under ROC curve = 0.97; 95% CI 0.95 to 0.99; P<0.0001

