Fig. 1.
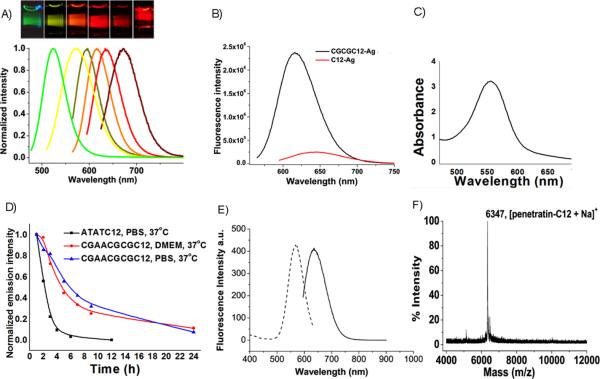
Emission and multicolor staining of various Ag nanodots. A, Normalized emission spectra of various emitters, from left to right: 523 nm (green C20), 562 nm (AATTC12), 590 nm (CGAAC12), 615 nm (CGCGC12), 635 nm (ATATC8), 670 nm (GGGGC8). (Inset) different color Ag emitters in cuvettes, each excited near their excitation maximum. B, Emission intensity comparison of Ag nanodots between sequence with a hairpin structure (CGCGC12: 5'-CGCGCCCCCCCCCCCCCGCG-3') and that with a simple polycytosine structure (C12: 5'-CCCCCCCCCCCC-3'), each at their highest intensities. C, Typical absorption spectrum of concentrated 615-nm emitter (1-cm light path). D, Thermal stability of CGAACGCGC12CGAACGCG-protected Ag nanodots compared to ATATC12-protected Ag nanodots. E, Excitation and emission spectra of aqueous penetratin-C12 silver clusters solution. Emission (solid) was excited at 575 nm, and excitation (dotted) was detected at 640 nm. F, MALDI mass spectrum of penetratin-C12 conjugate.

