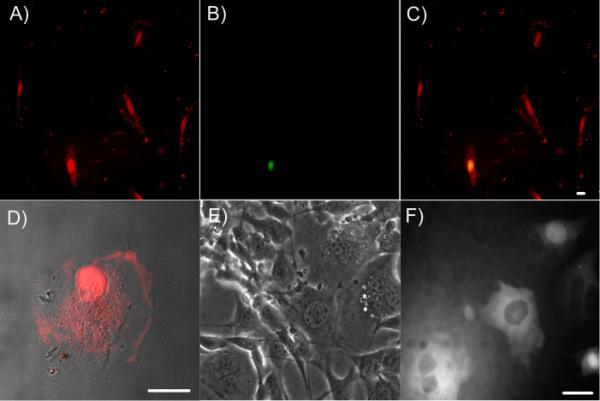
Fig. 3.

Intracellular delivery of DNA-encapsulated Ag nanodots. A–D, Penetratin-enhanced Ag nanodot internalization. A to C, colocalization of NIH 3T3 cells co-incubated with penetratin-C12 Ag nanodots and Sytox Green nuclear staining dye which only stains nuclei of cells with compromised membranes. The merge (C) of red emission (A) from penetratin-C12 Ag nanodots and green emission (B) from Sytox Green indicates that only a few cells show poor membrane integrity. Panels A–C are at the same scale. Penetratin-C12 Ag nanodots were excited at 543 nm and Sytox Green at 488 nm. D, Merge of a bright field image and a fluorescent image of BPAECs incubated with penetratin-C12 Ag nanodots for 10 min. E and F, 615 nm emitter was micro-injected into NIH 3T3 cells, shown in phase contrast (E) and fluorescence after microinjection (F). All scale bars are 25 μm.
