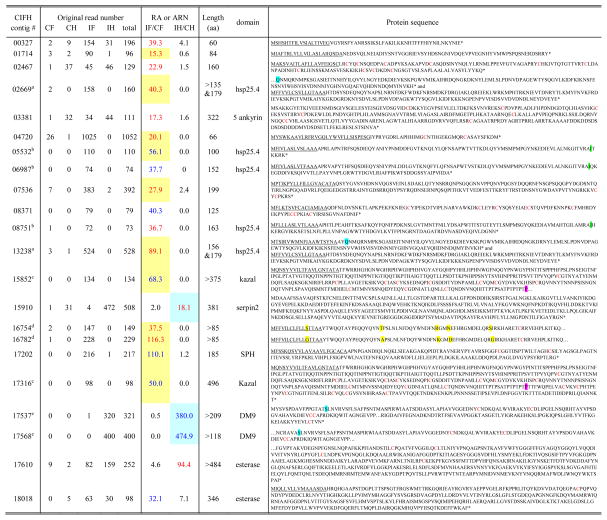
Table 6.
A list of 22 UP CIFH contigs without BLAST hit*

|
RA and ARN are calculated using original read numbers as described in Section 2.3. Listed here are contigs with RAIF/CF >15, RAIH/CH >15, ARNIF >30 when RNCF =0, or ARNIH >30 when RNCH =0. Contigs with total read numbers lower than 70 or GC content lower than 35% are not listed. Some of the contig sequences have been extended using sequences in dataset “06” (Table 1, Zou et al., 2008) and in the M. sexta gut EST dataset (Pauchet et al., 2009). RAIF/CF and RAIH/CH values are shown in red if they are greater than 15, while ARNIF and ARNIH values are shown in blue if they are higher than 30. In the two columns of RA or ARN, cells shaded yellow and blue represent fat body- and hemocyte-specific gene expression, respectively. The complete list of 528 UP CIFH contigs is in Table S1. The contigs labeled with the same letter (a to e) in superscript indicate high sequence similarity between them, as highlighted with different colors at certain key sites of the protein sequences. Underlined sequences represent putative signal peptides. The * indicates the end of protein sequence (stop codon).
