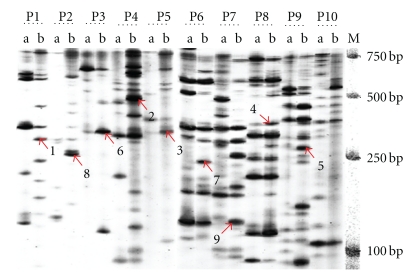
Figure 1.
PAGE electrophoresis patterns of some cDNA-AFLP amplification products. Notes: primers of P1–P10 represent E-AAC/M-CAG, E-ACA/M-CAG, E-ACA/M-CTC, E-AAC/M-CTT, E-AGG/M-CTC, E-AAG/M-CAT, E-AAG/M-CTA, E-AGC/M-CAG, E-AGG/M-CAT, and E-AGG/M-CTG, respectively; a, b represent control group and treat group, respectively; 1–9 represent SUC09, SUC01, SUC34, SUC07, SUC20, SUC06, SUC10, SUC22, and SUC39, respectively; M represents molecular weight marker.

