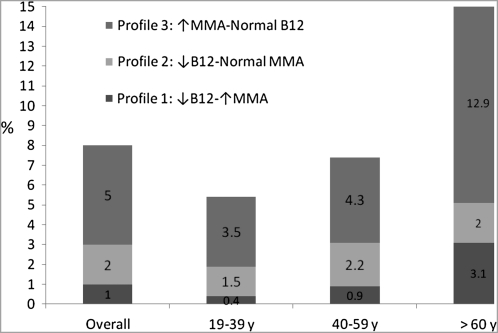
FIGURE 1.
The prevalence of different metabolic profiles of biomarkers of vitamin B-12 (B12) status. Shaded bars show least-squares means for respondents with low vitamin B-12 (<148 pmol/L) and normal methylmalonic acid (MMA; <271 nmol/L) concentrations, elevated MMA (>271 nmol/L) and normal vitamin B-12 (>148 pmol/L) concentrations, and low vitamin B-12 (<148 pmol/L) and elevated MMA (>271 nmol/L) concentrations for the US population and by age groups (NHANES, 1999–2004). We combined the data for adults aged ≥19 y (n = 16,184) from NHANES 1999–2000, 2001–2002, and 2003–2004. We excluded data from respondents with interview data only (ie, no mobile examination center data, RIDSTATR = 1; n = 1160), high creatinine concentrations (>120 μmol/L for men, >110 μmol/L for women; n = 548), and missing MMA data (n = 918). We also excluded data for lactating (n = 145) and pregnant (n = 801) women. The analytic sample included data for 12,612 respondents. NHANES assessed serum vitamin B-12 by using the Quantaphase II radioassay from Bio-Rad (Hercules, CA), plasma MMA by using gas chromatography–mass spectrometry, and plasma homocysteine with a fluorescence polarization immunoassay reagent kit from Abbott Laboratories (Abbott Park, IL). Our analysis controlled for age, sex, race-ethnicity, serum creatinine concentration, session of blood collection, and hours of fasting before blood collection.

