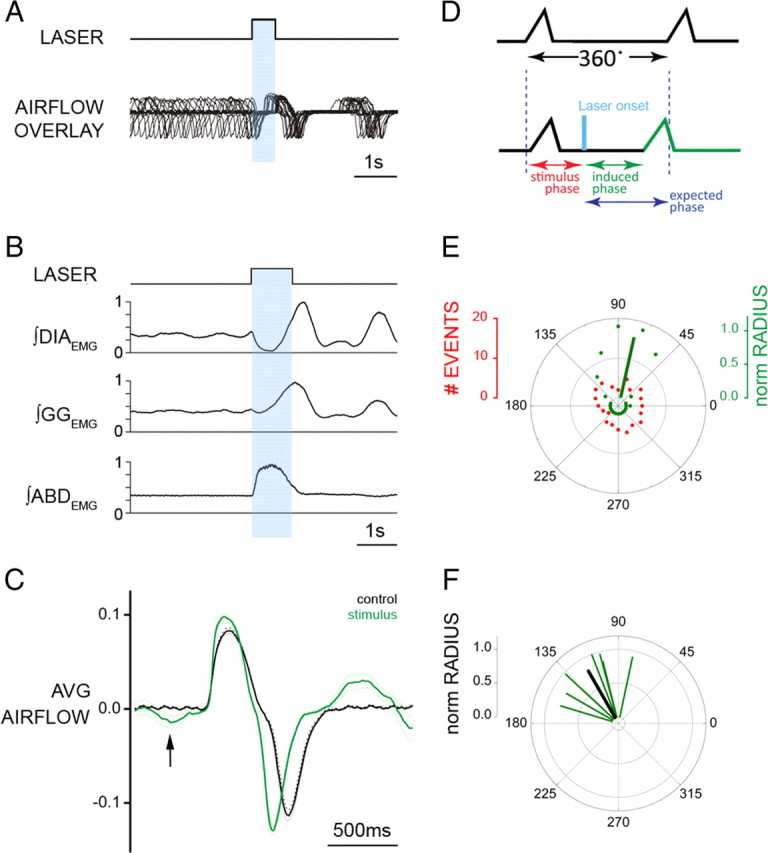
Figure 6.

Brief photostimulation of RTN/pFRG neurons resets respiratory cycle. A, Superposition of respiratory airflow traces (n = 35) during unilateral 500 ms pulse photostimulation, which resets and aligns the subsequent traces. B, Averaged traces for ∫DIAEMG, ∫GGEMG, and ∫ABDEMG show reset of EMG on photostimulation (1 s pulse; n = 35 cycles). Data normalized from 0 to 1. C, Averaged flow before (black) and after (green) 500 ms photostimulation (n = 35 cycles) aligned to inspiratory onset. The arrow indicates expiratory airflow induced by photostimulation. The dotted line indicates the 95% confidence interval for the mean. D, Phases in reset phase analysis. Top trace, Control respiratory cycle (from 0 to 360°, measured from the onset of one inspiration to the next). Bottom trace, Respiratory cycle during stimulation. Stimulus phase, Onset of photostimulation with respect to the phase of respiration; induced phase, onset of inspiration subsequent to delivery of photostimulation; expected phase, expected onset of the next inspiratory cycle with respect to stimulus onset if photostimulation had no effect (360° minus stimulus phase). E, Distribution of events for stimulus and induced phases during multiple trials of 500 ms photostimulation delivered during the same experiment (A). Although stimuli were distributed randomly across all phases of respiration (red dots), the stimulus-induced phase values (green dots) demonstrated clustering at a tight range of preferred phase angles. The average preferred angle for the induced phase is overlaid as a green vector. The left scale bar indicates radial distance for number of events (0–20) for stimulus or induced phase. The right scale bar indicates normalized radial length for vector (0–1, with values close to 1 being indicative of low dispersion of angles and significant phase preferences in polar distributions). F, Distribution of preferred phases of stimulus-induced respiration for seven separate experiments plotted as vectors in normalized length units (green) and the calculated grand average (black) across all experiments.
