Fig. 1.
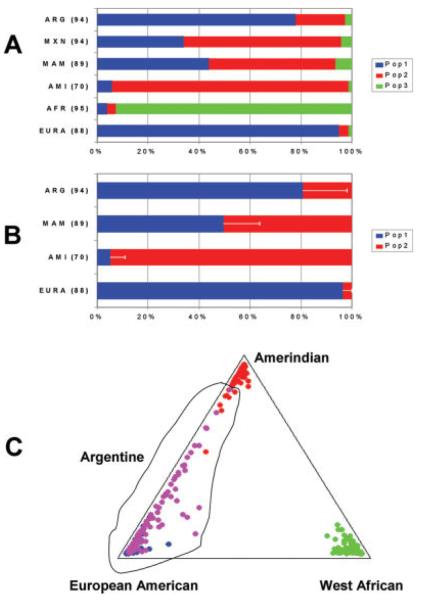
Estimation of ancestry contributions to the Argentine population using by a Bayesian analysis of population genetic structure. In panel A the results of STRUCTURE analysis (k = 3) using 44 AIMs selected for European, Amerindian, and African information (see methods) are shown. In panel B the results of STRUCTURE analysis using 66 European/Amerindian AIMs (k = 2) is shown. For both panel A and B, the mean population group assignment is shown by color code and the number of subjects in each group is shown in parenthesis. The population groups were European American (EURA), Amerindian (AMI), West African, (AFR), Mexican (MXN), Mexican American (MAM), and Argentine (ARG). In Panel B, the standard deviation is shown for the Amerindian assignment of the individuals. The large standard deviation (SD) observed in the admixed populations are due to the large variation in the individual members of these population groups. The variation in the means between different STRUCTURE runs is <0.5%. In Panel C the same results as panel A are shown for 88 individual EURA subjects (blue), 70 AMI subjects (red), 95 AFR subjects (green), and 94 ARG subjects (magenta) in a triangle plot of the color coded cluster groups corresponding to self identified population affiliations.

